What is the tidal stream calculator?
Tidal streams are the horizontal flows of water caused by the rise and fall of the tide. Their strength changes through the tidal cycle and from day to day, being strongest at springs and weakest at neaps. This calculator estimates the stream rate at a chosen hour after slack water so that you can plan a passage, judge when a tidal gate opens and estimate the drift you must allow for.
How to use it
Enter the peak spring and neap rates from the tidal stream atlas or almanac, the mean spring and neap ranges for the reference port, and the tidal range on your day of passage. Then enter the hours after slack water (0 to 6). The tool returns the interpolated peak rate, the rate at your chosen hour, and the distance the water moves over the following hour.
The formula explained
First the peak rate is interpolated by tidal range:
$$v_{max} = v_n + \frac{R - R_n}{R_s - R_n}(v_s - v_n)$$
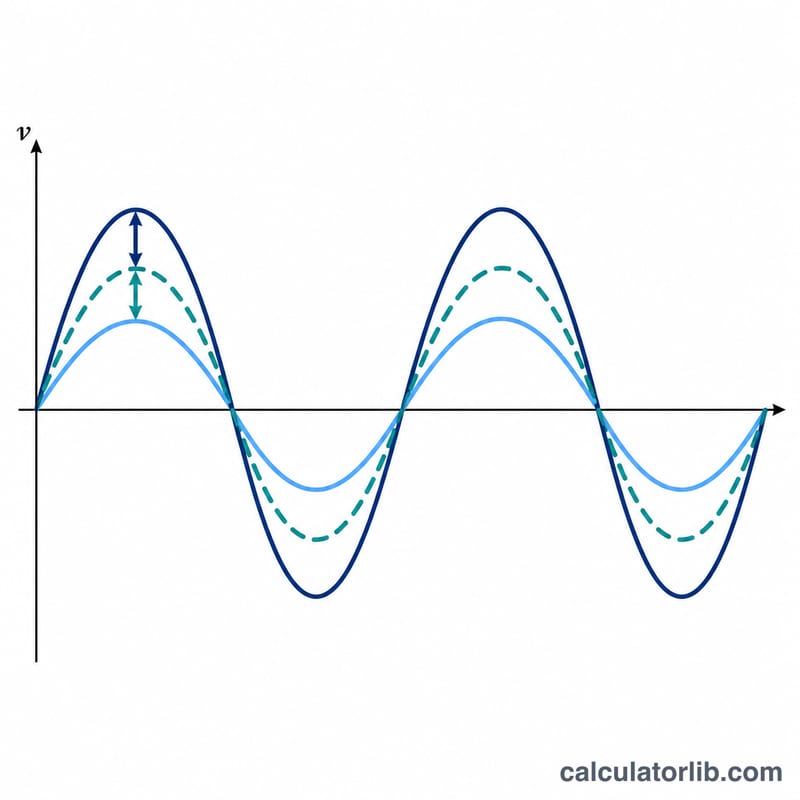
where \(v_s\) and \(v_n\) are the spring and neap peak rates, \(R_s\) and \(R_n\) the spring and neap ranges, and \(R\) the range on the day. The factor is limited to between 0 and 1. The rate through the cycle is then approximated by a sine curve:
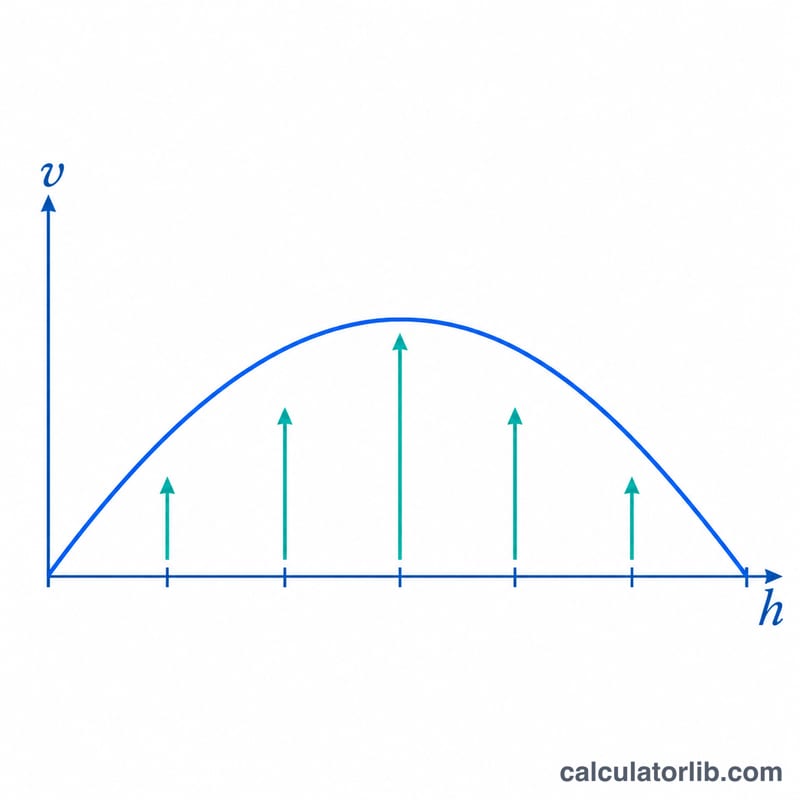
$$v(t) = v_{max}\sin\left(\frac{\pi t}{6}\right)$$
where \(t\) is the time in hours after slack water. The drift in one hour is the integral of this curve over that hour.
Worked example
Take \(v_s = 3.0\) kn, \(v_n = 1.5\) kn, \(R_s = 5.0\) m, \(R_n = 2.0\) m and \(R = 4.0\) m.
$$v_{max} = 1.5 + \frac{4 - 2}{5 - 2}(3.0 - 1.5) = 2.5\,\text{kn}$$
At \(t = 1\) hour: $$v(1) = 2.5\sin\left(\frac{\pi}{6}\right) = 1.25\,\text{kn}$$ At \(t = 3\) hours the stream is at its peak of 2.5 kn.
Hourly Stream Rate as a Fraction of Peak (Sine Model)
The calculator uses the sine model \(v = v_{max}\,\sin(\pi t/6)\), where \(t\) is the number of hours after slack water. The model assumes a symmetric half-cycle of 6 hours between one slack and the next. Real tidal streams can be asymmetric, and local atlases and almanacs take priority where they differ.
| Hours after slack (t) | sin(πt/6) | Rate as fraction of peak | Hour just ended | Drift in that hour (nautical miles per knot of peak rate) |
|---|---|---|---|---|
| 0 | 0 | 0% | – | – |
| 1 | 0.50 | 50% | 1st hour (0–1 h) | 0.256 |
| 2 | 0.87 | 87% | 2nd hour (1–2 h) | 0.699 |
| 3 | 1.00 | 100% | 3rd hour (2–3 h) | 0.955 |
| 4 | 0.87 | 87% | 4th hour (3–4 h) | 0.955 |
| 5 | 0.50 | 50% | 5th hour (4–5 h) | 0.699 |
| 6 | 0 | 0% | 6th hour (5–6 h) | 0.256 |
The drift in each hour is the integral of the sine curve over that hour: \(\frac{6}{\pi}\left[\cos\frac{\pi a}{6} - \cos\frac{\pi (a+1)}{6}\right] \times v_{max}\) nautical miles, with \(v_{max}\) in knots. The factors above are that bracket multiplied by \(6/\pi\). They sum to \(12/\pi \approx 3.82\) over the full 6 hours. This is the same as the usual rule of thumb that the total drift over a half-cycle is about 3.8 × the peak rate in knots. The rule of twelfths (1/12, 2/12, 3/12, 3/12, 2/12, 1/12) is a coarser approximation of the same shape.
How to Calculate the Stream Rate by Hand
- Read the data. From the tidal stream atlas, chart diamond or almanac, take the spring peak rate \(v_s\), the neap peak rate \(v_n\), and the matching spring range \(R_s\) and neap range \(R_n\) at the reference port. Take the day's tidal range \(R\) from the tide tables (high water height minus low water height).
- Compute the range factor. \(f = \dfrac{R - R_n}{R_s - R_n}\). Clamp it to between 0 and 1, so a range beyond spring or neap does not extrapolate the rate.
- Compute the peak rate. \(v_{max} = v_n + f\,(v_s - v_n)\).
- Apply the sine factor. For \(t\) hours after slack (0 to 6), \(v = v_{max}\,\sin(\pi t/6)\). For example, at 2 hours the factor is 0.866.
- Find the drift. Multiply \(v_{max}\) by the hourly drift factor from the table (0.256, 0.699, 0.955, 0.955, 0.699, 0.256) to get the nautical miles carried by the stream during that hour. Add the hours together for longer passages.
- Check direction and timing. Confirm the stream direction (set) for each hour in the atlas, and check the time of slack water locally. Slack water does not always coincide with high or low water. Treat the result as an estimate, not a substitute for official local data.
Comparing Neap, Mean and Spring Conditions
These figures use the worked example inputs: spring rate 3.0 kn, neap rate 1.5 kn, spring range 5.0 m, neap range 2.0 m. The three columns change only the day's tidal range.
| Condition | Tidal range | Range factor f | vmax (kn) | Rate at 1 h (kn) | Rate at 2 h (kn) | Rate at 3 h (kn) | Drift in 1st hour (nm) |
|---|---|---|---|---|---|---|---|
| Neap | 2.0 m | 0 | 1.50 | 0.75 | 1.30 | 1.50 | 0.38 |
| Mean | 3.5 m | 0.5 | 2.25 | 1.13 | 1.95 | 2.25 | 0.58 |
| Spring | 5.0 m | 1 | 3.00 | 1.50 | 2.60 | 3.00 | 0.77 |
Mean-range substitution: \(f = (3.5 - 2.0)/(5.0 - 2.0) = 0.5\), so \(v_{max} = 1.5 + 0.5\times(3.0 - 1.5) = 2.25\) kn. At 2 h, \(v = 2.25 \times 0.866 \approx 1.95\) kn. First-hour drift is \(2.25 \times 0.256 \approx 0.58\) nm. Spring streams carry twice the peak rate and twice the first-hour drift of neap streams in this example. This is why passage timing matters more on spring tides.
FAQ
Is this accurate enough for navigation?
It is a planning estimate based on a simplified sine model. Always use official tidal stream atlases, local pilots and current predictions for actual navigation.
Why does the rate depend on tidal range?
Stream strength scales roughly with the volume of water moved, which follows the tidal range, so larger ranges give faster streams.
Can I use it for any location?
Yes, as long as you use spring and neap rates and ranges for that location. Streams in rivers or narrow channels may not follow a sine curve.