What a water footprint is
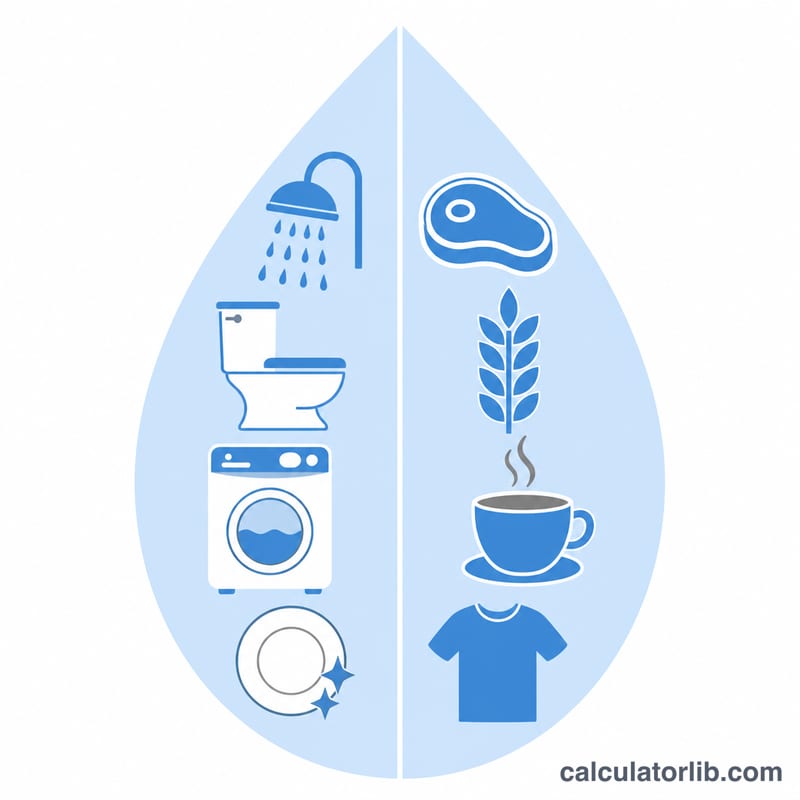
Your water footprint is the total volume of freshwater used to produce everything you consume, not just the water that comes out of your taps. Hydrologists split it into direct water (showers, toilets, laundry, dishwashing) and virtual water (the water embedded in food, drinks and textiles). For most people the virtual share dominates: growing a kilogram of beef can take more than 15,000 litres, while a single cotton t-shirt averages about 2,700 litres.
How to use the calculator
Pick the diet that best matches your week, then enter your typical shower minutes, flushes, weekly laundry and dishwasher loads, daily coffee cups and the number of new cotton garments you buy in a year. Weekly and yearly items are converted to a daily rate so every component is comparable.
The formula
With \(S\) = shower minutes/day, \(F\) = flushes/day, \(L\) = laundry loads/week, \(D\) = dishwasher loads/week, \(V_{diet}\) = diet intensity in L/day, \(C\) = coffee cups/day and \(G\) = cotton garments/year:
$$WF_{daily} = \left(9S + 6F + \frac{50L}{7} + \frac{15D}{7}\right) + \left(V_{diet} + 132C + \frac{2700G}{365}\right)$$The yearly figure is simply \(WF_{year} = 365 \times WF_{daily}\).
Estimates use widely cited average virtual-water intensities (litres of water embedded per unit of product) and typical fixture flow rates. Actual figures vary with climate, farming methods and appliance efficiency.
Worked example
A mixed-diet adult takes 8-minute showers, flushes 5 times a day, runs 4 laundry and 3 dishwasher loads a week, drinks 2 coffees a day and buys 10 cotton garments a year:
$$WF_{direct} = 72 + 30 + \frac{200}{7} + \frac{45}{7} = 137\ \text{L/day}$$$$WF_{virtual} = 3600 + 264 + \frac{27000}{365} = 3937.97\ \text{L/day}$$Total: \(4074.97\) L/day, or about \(1{,}487{,}365\) litres a year. Direct use is only \(3.4\%\) of the total.
Fixture Flow Rates and Fixed Values Used
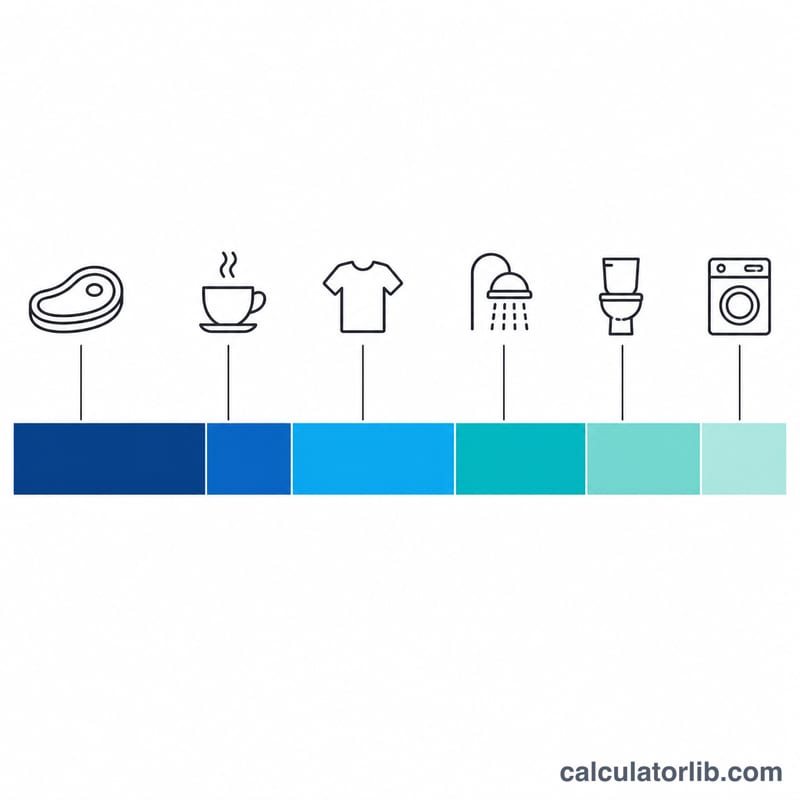
The calculator combines your inputs with a fixed set of coefficients. Every one of them is a generic international average drawn from published water-footprint and household-water literature — none is a measurement of your own fixtures, your local crops or your local electricity mix. Real values vary by a factor of two or more in both directions, so treat the output as an order-of-magnitude estimate rather than a meter reading.
| Item | Value used | Unit | Typical real-world range / note |
|---|---|---|---|
| Shower | 9 | litres per minute | Low-flow / aerated heads ≈ 6 L/min; older unrestricted heads ≈ 15 L/min. The US EPA WaterSense label caps showerheads at 2.0 gpm ≈ 7.6 L/min. |
| Toilet flush | 6 | litres per flush | Modern single- or dual-flush full flush. Pre-1994 US and pre-1990s European units used ≈ 13–19 L; dual-flush half flushes are ≈ 3 L. The 6 L (1.6 gpf) figure reflects the US Energy Policy Act 1992 standard in force from 1994 and comparable EU/AU requirements. |
| Washing machine | 50 | litres per load | Efficient front-loader. Top-loaders (common in North America, Australia and parts of Asia) use ≈ 100 L or more per load; very old machines exceed 150 L. |
| Dishwasher | 15 | litres per load | Efficient modern machine; compares with roughly 40 L for washing the same load by hand under a running tap. |
| Coffee | 132 | litres per cup | Virtual (supply-chain) water for one standard 125 ml cup of coffee, the widely cited Water Footprint Network figure — almost all of it rainwater used growing and processing the beans, not water in your kitchen. |
| Cotton garment | 2,700 | litres per garment | Commonly cited figure for one ≈ 250 g cotton T-shirt, dominated by irrigation and rainfall on the cotton field plus dyeing and finishing. Heavier items (jeans) are far higher; synthetics are much lower in water but not in other impacts. |
| Diet | 2,000 / 2,600 / 3,600 / 5,000 | litres per day | Four selectable tiers spanning roughly vegan → vegetarian/low-meat → average mixed → heavy meat. These are food-production footprints, again dominated by rainwater on farmland. |
Normalising the time bases
Laundry, dishwasher and clothing inputs are entered per week or per year, so they are divided down to a daily rate before being added:
Divisor 7 (days per week) for laundry and dishwasher loads; divisor 365 (days per year) for new cotton garments.
$$D = 9\,L_{\text{shower min}} + 6\,N_{\text{flush}} + \frac{50\,N_{\text{laundry/wk}}}{7} + \frac{15\,N_{\text{dish/wk}}}{7}$$$$I = F_{\text{diet}} + 132\,N_{\text{coffee/day}} + \frac{2700\,N_{\text{garments/yr}}}{365}$$with the reported answer \(W_{\text{total}} = D + I\) in litres per day, and \(W_{\text{total}} \times 365 / 1000\) giving cubic metres per year. Note that the shower coefficient is fixed at 9 L/min: to represent a genuine low-flow head, scale the minutes you enter (a 4-minute shower at 6 L/min = 24 L ≈ 2.7 minutes at 9 L/min).
How the Footprint Changes Across Realistic Scenarios
Every row below is computed with the formula and constants given above, so the figures reconcile exactly. Because the diet input offers four fixed tiers, a "low-meat" eater is represented by the nearest available tier (2,600 L/day) — the calculator does not interpolate between tiers.
| Scenario | Diet (L/day) | Shower (min) | Flushes/day | Laundry/wk | Dishwasher/wk | Coffee/day | Garments/yr | Direct L/day | Virtual L/day | Total L/day | Total m³/yr |
|---|---|---|---|---|---|---|---|---|---|---|---|
| Heavy meat-eater, long showers, fast fashion | 5,000 | 12 | 6 | 5 | 4 | 3 | 20 | 188 | 5,544 | 5,732 | 2,092 |
| Average mixed diet (worked example) | 3,600 | 8 | 5 | 4 | 3 | 2 | 10 | 137 | 3,938 | 4,075 | 1,487 |
| Low-meat diet, same habits | 2,600 | 8 | 5 | 4 | 3 | 2 | 10 | 137 | 2,938 | 3,075 | 1,122 |
| Vegetarian, moderate habits | 2,600 | 7 | 5 | 3 | 3 | 1 | 8 | 121 | 2,791 | 2,912 | 1,063 |
| Vegan, moderate habits | 2,000 | 7 | 5 | 3 | 3 | 1 | 8 | 121 | 2,191 | 2,312 | 844 |
| Mixed diet, 4-min low-flow shower (entered as 3 min), no new cotton | 3,600 | 3 | 5 | 4 | 3 | 2 | 0 | 92 | 3,864 | 3,956 | 1,444 |
Worked example, substituted in full
Average mixed diet row, direct component:
$$D = 9(8) + 6(5) + \frac{50(4)}{7} + \frac{15(3)}{7} = 72 + 30 + 28.57 + 6.43 = 137.0\ \text{L/day}$$Virtual component:
$$I = 3600 + 132(2) + \frac{2700(10)}{365} = 3600 + 264 + 73.97 = 3937.97\ \text{L/day}$$$$W_{\text{total}} = 137.0 + 3937.97 = 4074.97 \approx 4075\ \text{L/day} = \frac{4075 \times 365}{1000} \approx 1487\ \text{m}^3\text{/yr}$$The lesson in the last row
Halving the shower and buying no new cotton for a year cuts 45 L/day and 74 L/day respectively — 119 L/day in total, which moves 4,075 down to 3,956, a reduction of about 2.9%. Switching the same household from the mixed tier to the low-meat tier changes the answer from 4,075 to 3,075, a 24.5% cut. Within this model, diet dominates everything else by roughly an order of magnitude, which is why direct-use savings alone barely shift the total. That is a statement about the arithmetic of virtual water, not a ranking of which action matters most where you live — see the next section.
What Your Litres-Per-Day Figure Means
Where your number sits globally
Studies by the Water Footprint Network (Hoekstra and Mekonnen) put the global average consumption water footprint at roughly 3,800 litres per person per day, about 1,385 m³ per year. High-consumption countries — typically wealthy nations with meat-heavy diets and water-intensive imports, the United States among them — sit above roughly 7,000 L/day (over 2,500 m³/yr), while many countries in South and East Asia and parts of Africa fall below roughly 2,000 L/day. A result near 4,000 L/day is therefore unremarkable by global standards even though it sounds enormous.
Direct use is a small slice
In this calculator, showers, flushes, laundry and the dishwasher together typically come to 90–200 L/day — on the order of 2–5% of the total. That ratio matches published national footprints, where household tap water is a minor share of the water embodied in food, drinks, clothing and other goods. Two reference points apply to direct use only, not to the total:
- ≈ 50 L/person/day is widely cited as the minimum for basic domestic needs — drinking, cooking, bathing, sanitation and basic hygiene.
- ≈ 100 L/person/day is the level often referenced alongside WHO guidance as comfortably meeting all domestic needs with low health risk.
Both are far below what a typical household in a piped-water country actually uses, and neither has anything to say about the virtual component.
Green, blue and grey water
Water footprints split into three colours, and this calculator's single total mixes all of them:
- Green — rainwater stored in soil and used by growing plants. Globally this is roughly three-quarters of the water footprint of production, and it is the bulk of the diet, coffee and cotton figures used here.
- Blue — surface and groundwater withdrawn for irrigation, industry and the tap. This is around a tenth of the global total but matters most for scarcity, because it competes directly with rivers, aquifers and other users.
- Grey — the volume of freshwater needed to dilute pollution loads (fertiliser runoff, dye effluent) back to ambient quality standards.
Two people with identical 4,000 L/day totals can have very different impacts: rain-fed grain in a wet region is not equivalent to irrigated cotton drawn from a depleting aquifer.
A high total is not automatically a local problem
Most virtual water is imported. If your coffee, cotton and animal feed are grown thousands of kilometres away, your footprint is felt in those catchments — and may be a genuine stress there, or may be a rainfall surplus with no scarcity implications at all. Conversely, a modest total can still be damaging if its blue-water share is drawn from a stressed basin near you. Because of this, the litres-per-day figure is best read as a scale indicator and a comparison tool between your own scenarios — not as a score, and not as a personal target to hit. There is no published per-person footprint threshold that is correct everywhere.
Finally, keep in mind what the number is made of: fixed average coefficients, four diet tiers and no geography. It is useful for seeing which category dominates your consumption and how much a change would move it; it is not a measurement of your household or of water stress in any particular place. For decisions with real consequences — utility bills, agricultural planning, regulatory reporting — use metered data and locally sourced coefficients.
FAQ
Why is my footprint so large? Because agriculture, not plumbing, uses most freshwater. Diet choices move the number far more than shorter showers.
What cuts it fastest? Replacing a few beef meals with pulses or poultry, and wasting less food, typically saves hundreds of litres a day.
Is this jurisdiction-specific? No. It uses global average water-intensity figures and generic fixture flow rates, so it applies anywhere, though local farming and appliance efficiency shift the real numbers.