
What this calculator does
A carbon footprint is the total greenhouse gas released to support your lifestyle over a year, expressed in kilograms or tonnes of carbon dioxide equivalent (CO2e). This tool estimates the four largest household drivers: car travel, air travel, home energy, and food. It uses global average emission factors rather than one country rules, so it is a useful comparison tool anywhere; if you know your own utility grid factor, enter it for a much sharper result.
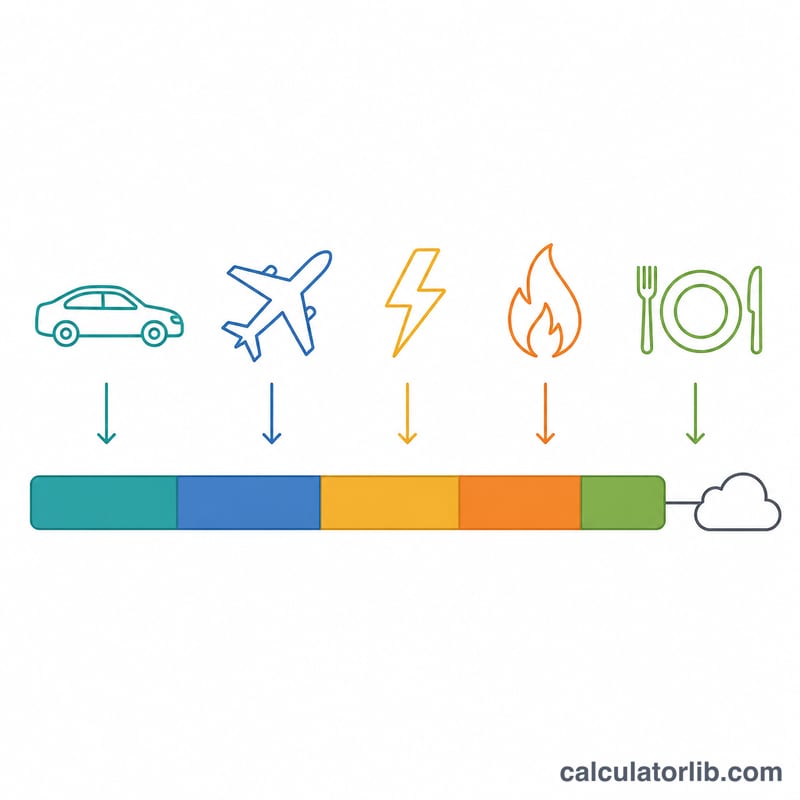
How to use it
Enter the kilometres you drive in a year and your car fuel consumption in litres per 100 km, your annual passenger-kilometres flown, your monthly electricity and gas use from your bills, and how many people share the home. Home energy is split across the household because a shared meter is not one person footprint; car, flights and diet are counted per person.
The formula
The total is a simple sum of category estimates:
$$E_{\text{total}} = E_{\text{car}} + E_{\text{air}} + E_{\text{home}} + E_{\text{diet}}$$with \(E_{\text{car}} = \frac{d \times c}{100} \times 2.31\), where \(d\) = km driven and \(c\) = litres per 100 km; \(E_{\text{air}} = f \times 0.15\) for \(f\) passenger-km; and \(E_{\text{home}} = \frac{12\,(k \times g + m \times 1.9)}{n}\) for \(k\) kWh and \(m\) cubic metres of gas per month, grid factor \(g\), and \(n\) people.

Worked example
Driving 12,000 km at 8 L/100 km, flying 4,000 km, using 300 kWh of electricity at 0.45 kg/kWh plus 50 m³ of gas per month in a two-person home, on an average mixed diet (2,500 kg/yr):
$$E_{\text{car}} = \frac{12000 \times 8}{100} \times 2.31 = 2217.6\,\text{kg}$$$$E_{\text{home}} = \frac{12\,(300 \times 0.45 + 50 \times 1.9)}{2} = 1380\,\text{kg}$$$$E_{\text{total}} = 2217.6 + 600 + 1380 + 2500 = 6697.6\,\text{kg} = 6.70\,\text{t}$$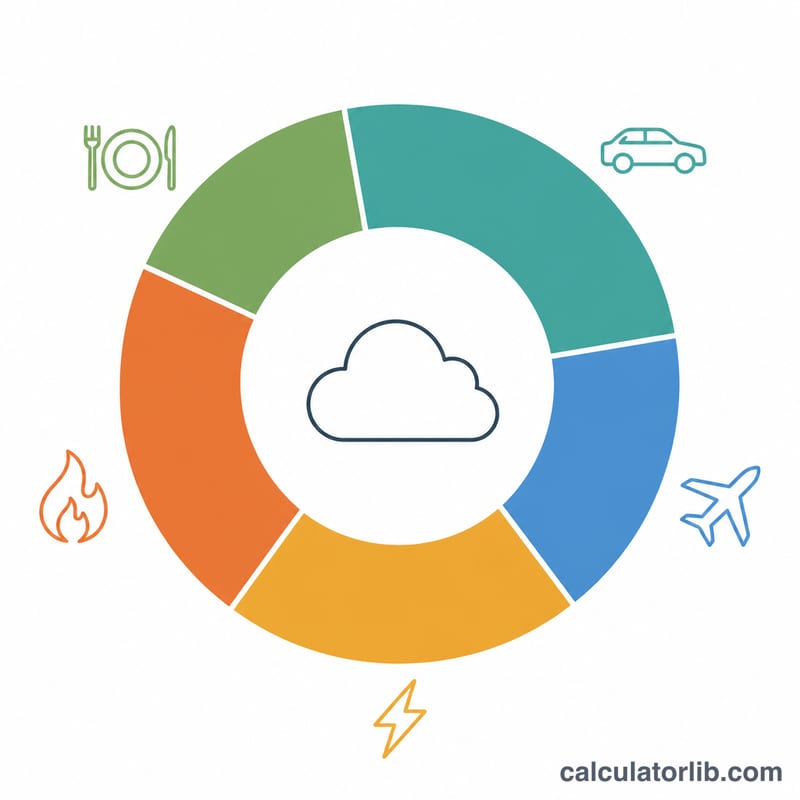
Emission Factors and Grid Intensity Values
The calculator converts each activity into kilograms of carbon dioxide equivalent (kg CO2e) using the factors below, then sums them and divides by 1,000 to report tonnes per year. All values are global or broadly representative averages drawn from the general life-cycle literature — they are not the official published factors of any one country (such as the UK DEFRA conversion factors, the US EPA emission factors, or an EU national inventory). If you need figures for regulatory or corporate reporting, use your own country's official factor set instead.
Fuel and travel factors
| Item | Factor | Units | Notes |
|---|---|---|---|
| Petrol / gasoline (used by this tool) | 2.31 | kg CO2e per litre burned | Tailpipe combustion; excludes refining and distribution (well-to-tank), which add roughly 15–20%. |
| Diesel | ≈ 2.68 | kg CO2e per litre burned | Denser fuel, so more CO2 per litre — but diesel cars typically use fewer litres per 100 km. |
| Air travel (used by this tool) | ≈ 0.15 | kg CO2e per passenger-kilometre | Economy-class average across haul lengths. |
| Air travel — short-haul (< ~1,500 km) | ≈ 0.15–0.25 | kg CO2e per passenger-km | Higher per km: take-off and climb dominate a short flight. |
| Air travel — long-haul (> ~3,700 km) | ≈ 0.11–0.15 | kg CO2e per passenger-km | Slightly lower per km in economy; premium and business seats occupy 2–4× the floor area and carry a correspondingly larger share. |
| Natural gas (used by this tool) | ≈ 1.9 | kg CO2e per m³ of gas | Equivalent to roughly 0.18 kg CO2e per kWh of gas energy, since 1 m³ ≈ 10.5 kWh. |
Electricity grid intensity (choose the value closest to your grid)
| Grid type | Grid factor \(g\) | Units | Typical of |
|---|---|---|---|
| Coal-dominated | 0.80 – 1.00 | kg CO2e per kWh | Systems where coal supplies most generation. |
| Mixed fossil / world average | ≈ 0.45 | kg CO2e per kWh | Default when you do not know your supplier's figure. |
| Gas-dominated | ≈ 0.35 – 0.45 | kg CO2e per kWh | Combined-cycle gas plus some renewables. |
| Nuclear- or hydro-heavy | 0.05 – 0.10 | kg CO2e per kWh | Grids largely supplied by nuclear, hydro, wind or solar. |
| Contracted 100% renewable tariff | 0.00 – 0.05 | kg CO2e per kWh | Market-based accounting only; the physical grid mix is unchanged. |
Many utilities and national energy agencies publish an annual grid intensity for their own territory; that published number, when you have it, is always a better input than the bands above. Intensities also fall year on year in most systems as renewables are added, so a figure more than two or three years old will usually overstate your electricity emissions.
Annual diet factors
| Diet | Factor | Units | Selectable value |
|---|---|---|---|
| Heavy meat eater (meat at most meals) | ≈ 3,300 | kg CO2e per person per year | 3300 |
| Average mixed diet | ≈ 2,500 | kg CO2e per person per year | 2500 |
| Low-meat diet (meat a few times a week) | ≈ 2,000 | kg CO2e per person per year | choose 1900, the nearest option |
| Pescatarian (fish, no meat) | ≈ 1,900 | kg CO2e per person per year | 1900 |
| Vegetarian (dairy and eggs) | ≈ 1,700 | kg CO2e per person per year | 1700 |
| Vegan (no animal products) | ≈ 1,500 | kg CO2e per person per year | 1500 |
| Low-footprint plant-based (mostly local, minimal waste) | ≈ 1,100 | kg CO2e per person per year | 1100 |
Diet factors are whole-diet life-cycle estimates covering farming, processing, transport and typical household food waste, expressed per person. They are averages across a whole population's shopping habits, so a single household can legitimately sit some hundreds of kilograms either side of the band it selects. Ruminant meat (beef, lamb) and dairy account for most of the spread between the top and bottom rows.
Interpreting Your Annual Footprint
The result is a per-person figure in tonnes of CO2e per year. On its own a number like 6.9 t means little; it becomes informative when placed against published per-capita benchmarks and read category by category.
Benchmark bands (tonnes CO2e per person per year)
| Band | Approximate level | What it represents |
|---|---|---|
| Low-income country averages | under 1 t | Many countries in sub-Saharan Africa and South Asia; limited electricity access, little or no flying. |
| Paris-aligned mid-century level | ≈ 2 t | The order of magnitude of per-person emissions consistent with net-zero pathways around mid-century — a target level, not a current average. |
| Global average | ≈ 4.7 t | Total world emissions divided by world population. |
| Typical high-income Western European | ≈ 7 – 9 t | Countries such as France, Germany, Italy, Spain and the UK, on a per-capita basis. |
| Typical North American | ≈ 14 – 16 t | United States and Canada; larger homes, longer driving distances, more air travel. |
National per-capita figures come from whole-economy inventories and therefore include industry, agriculture, public services and infrastructure that no household calculator can attribute to an individual. Compare your number to them as an order-of-magnitude reference, not as a like-for-like score.
Reading the category breakdown
The breakdown matters more than the total. In most household results, one or two categories carry the majority of the footprint:
- Flights swing the total the hardest because the factor is applied to raw distance. At 0.15 kg CO2e per passenger-km, a single 10,000 km round trip adds \(10{,}000 \times 0.15 = 1500\) kg, or 1.5 t — comparable to an entire year of a vegan diet.
- Driving is the other large lever, since it multiplies three quantities: distance, fuel consumption and the fuel factor. Driving 15,000 km at 8 L/100 km gives \(\frac{15{,}000 \times 8}{100} \times 2.31 = 2772\) kg, or 2.8 t.
- Electricity is dominated by the grid factor, not by consumption. The same 300 kWh per month produces roughly nine times more CO2e on a coal-heavy grid (\(g \approx 0.9\)) than on a hydro- or nuclear-heavy one (\(g \approx 0.1\)).
- Diet is a flat annual band, so it sets a floor: it never varies with how much you travel and rarely falls below about 1.1 t.
Per-person versus per-household
Home energy — electricity and natural gas — is a shared household service, so both are divided by the household size before being added:
$$E = \frac{\text{kWh/month} \times 12 \times g}{\text{household size}}, \qquad G = \frac{\text{m}^3\text{/month} \times 12 \times 1.9}{\text{household size}}$$
Car travel, flights and diet are entered as your own, so they are not divided. One consequence is that a larger household lowers each member's home-energy share without any change in the meter reading, which is why household size must be entered honestly for the total to be comparable with the per-capita benchmarks above. If several people habitually share the same car journeys, enter only your share of the distance.
Worked reading of a mid-range result
A two-person household driving 12,000 km/yr at 7 L/100 km, flying 4,000 passenger-km, using 350 kWh/month on a world-average grid (\(g = 0.45\)) and 80 m³/month of gas, on an average mixed diet:
$$\frac{1940.4 + 600 + 945 + 912 + 2500}{1000} \approx 6.9\ \text{t CO}_2\text{e/yr}$$
The total, roughly 6.9 tonnes, sits inside the Western European band. Diet is the single largest slice at 2.5 t (36%), driving second at 1.94 t (28%); the two home-energy categories together contribute 1.86 t only after being halved across the household.
What the estimate excludes
This is a deliberately scope-limited calculation. It does not include manufactured goods and clothing, services (healthcare, finance, education), public transport, rail and coach travel, water and waste treatment, the embodied emissions of your home and vehicles, food's non-dietary packaging, or your share of public infrastructure and government spending. In consumption-based national accounts those omitted categories often make up a third or more of a person's total. It also uses generic factors rather than your utility's audited figures, and treats radiative forcing from aviation at altitude only implicitly, if at all.
Treat the output as a consistent comparison tool: it is well suited to ranking your own categories against each other, and to testing scenarios such as one fewer long flight or a lower-intensity grid, because the same assumptions apply to every run. It is not an audited greenhouse-gas inventory and should not be used for offsetting claims, corporate disclosure, or any regulated reporting, which require nationally specified factors and documented activity data.
FAQ
What is a good target? The global average is roughly 4.7 tonnes per person per year, and climate pathways point toward about 2 tonnes by mid-century.
Why is flying so heavy? At roughly 0.15 kg CO2e per passenger-kilometre, one 8,000 km return trip adds about 1.2 tonnes, comparable to months of driving.
Does an electric car score zero? No. Set fuel use to 0 and add the charging electricity to your monthly kWh so it is priced at your real grid factor.