
What this calculator does (India)
This tool is built for households in India. It converts everyday consumption into an estimated annual carbon footprint in tonnes of carbon dioxide equivalent (CO2e), using emission factors that reflect Indian conditions: a grid intensity of about \(0.71\) kg CO2e per kWh, domestic LPG cylinders of \(14.2\) kg, and typical Indian petrol car, two-wheeler and bus/metro intensities. Figures for grid intensity and diet are indicative national averages and change year to year, so treat the output as a planning estimate rather than an audited inventory.
How to use it
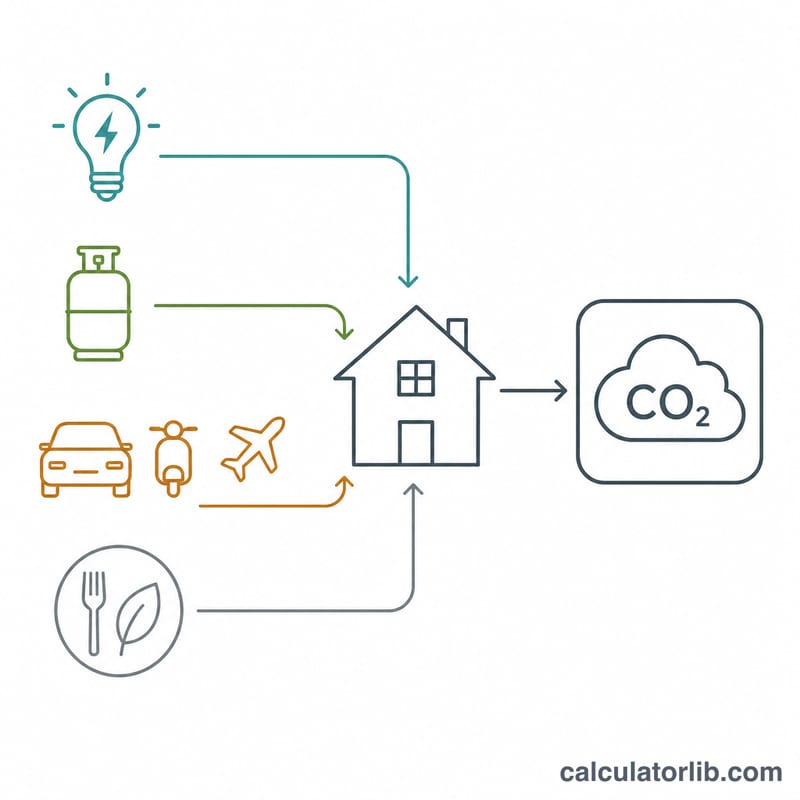
Read your monthly electricity units from the latest bill, count the LPG refills your family books in a year, and estimate monthly distance for the car, two-wheeler and public transport. Add domestic return flights and pick the diet that best describes the household. Enter the number of people so the tool can report a per-person figure, which is the number comparable to national averages.
The formula
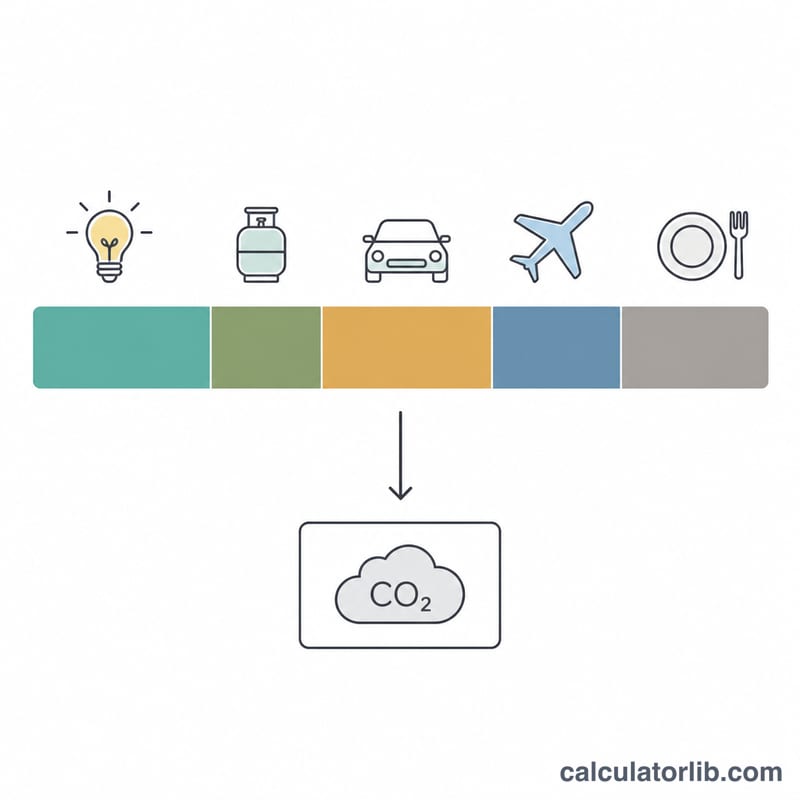
Total annual emissions are the sum of four buckets:
$$\text{CO}_2\text{e} = E_{\text{energy}} + E_{\text{travel}} + E_{\text{food}} + E_{\text{other}}$$where \(E_{\text{food}} = P \times f_{\text{diet}}\) with \(P\) = people in the household and \(f_{\text{diet}}\) between 1000 kg (vegetarian) and 1900 kg (daily non-vegetarian) per person, and \(E_{\text{other}} = P \times 400\) kg for goods, services and waste. The per-person result is \(\text{CO}_2\text{e} / P\).
Worked example
A family of four uses 300 units a month, 8 cylinders a year, drives a petrol car 500 km and a scooter 300 km a month, rides 100 km of bus, takes one return flight, and eats meat a few times a week:
$$E_{\text{energy}} = 12 \times 300 \times 0.71 + 8 \times 14.2 \times 2.98 = 2894.5\,\text{kg}$$$$E_{\text{travel}} = 12 \times (500 \times 0.171 + 300 \times 0.045 + 100 \times 0.028) + 250 = 1471.6\,\text{kg}$$Food adds \(4 \times 1500 = 6000\) kg and other consumption \(4 \times 400 = 1600\) kg, giving \(11966\) kg, or about \(2.99\) tonnes per person.
Interpreting Your Carbon Footprint Result
The calculator returns your whole household's annual emissions in tonnes of carbon dioxide equivalent (t CO2e). That number is not comparable to published national figures until you divide it by the number of people in the household — the standard unit for comparison is tonnes CO2e per person per year:
$$\text{Per-person footprint} = \frac{\text{Household total (t CO}_2\text{e/yr)}}{\text{Household members}}$$
For example, a household total of 12.85 t CO2e shared by 4 people is \(12.85 \div 4 = 3.21\) t CO2e per person per year.
Benchmarks to compare against
- India, national average: roughly 2 t CO2e per person per year. India's per-capita emissions are among the lowest of the major economies — well under half the world average.
- Global average: roughly 4.7 t CO2e per person per year across all countries.
- About 2 t CO2e per person per year is the level frequently cited as consistent with a 1.5 °C pathway by mid-century. It is a widely quoted planning target, not a legal limit, and different studies place it anywhere from roughly 1 to 2.5 t depending on the year and the accounting method.
So an Indian household landing near 2 t per person is already close to both the national average and the commonly cited 1.5 °C-consistent level; 3–4 t per person is a typical urban middle-class result; anything above about 6 t per person is high by Indian standards and is almost always driven by air travel or a car-heavy commute.
Which bucket usually dominates
- Food and "other" consumption — for most Indian households these two per-person allowances (1,000–1,900 kg for diet plus 400 kg for goods, services and waste) are the single largest block, simply because they scale with the number of people and are charged in full to every member.
- Electricity — usually the largest controllable household item, because India's grid is still coal-heavy at about 0.71 kg CO2e per kWh. A 400 kWh/month home emits roughly 3.4 t a year from electricity alone.
- Flights — negligible for most households, but decisive for frequent flyers. At about 250 kg per domestic return trip, six return flights add 1.5 t to one person's footprint, which on its own exceeds many households' entire electricity bill in carbon terms.
- Road travel — a petrol car driven 600 km a month adds about 1.23 t a year; the same distance on a two-wheeler adds about 0.32 t, and on a bus about 0.20 t.
What this number is — and is not
This is a planning estimate, not an audited greenhouse-gas inventory. It uses indicative national average emission factors for India and a small set of inputs, so it will not match a GHG Protocol or ISO 14064 verified figure. In particular:
- The grid factor is a national average. Actual grid intensity varies a great deal by state and by hour — a home in a hydro- or renewables-rich state may emit far less per kWh than one on a coal-dominated grid, and rooftop solar is not captured unless you reduce your billed kWh input.
- Diet is a flat per-person allowance by category, not a food diary. Real food footprints swing widely with dairy consumption, food waste and how far food travels.
- The 400 kg "other" allowance is a coarse stand-in for goods, services, waste and water — it does not respond to how much you actually buy.
- Flights are counted as generic domestic return trips. International long-haul flights emit several times more and are not represented by the 250 kg figure.
Use the result to compare scenarios and to see which lever matters most for you, rather than as a certified emissions figure. Emission factors are revised annually as the grid decarbonises, so a footprint computed today is not directly comparable to one computed several years ago.
Your per-person footprint is above the Indian average of about 1.9 tonnes CO2e. The largest lever is usually grid electricity and private car travel.
Your per-person footprint is at or below the Indian average of about 1.9 tonnes CO2e, and well under the global average of roughly 4.7 tonnes.
Emission Factors Used (India)
All factors below are indicative national averages for India in kilograms of CO2 equivalent. They are the values this calculator applies; other tools and official inventories may use different figures, and each is revised periodically.
| Item | Factor | Unit | Scope / what it covers | Status |
|---|---|---|---|---|
| Grid electricity | 0.71 | kg CO2e per kWh | Scope 2 — generation on the Indian national grid, coal-weighted | Indicative national average; falls each year as renewables grow |
| LPG (cooking gas) | 2.98 | kg CO2e per kg of LPG | Scope 1 — combustion at home | Indicative national average; subject to revision |
| Domestic LPG cylinder | 14.2 | kg of LPG per refill | Standard Indian domestic cylinder size | Standard fill weight, not an emission factor |
| Per LPG refill (derived) | ≈ 42.3 | kg CO2e per cylinder | \(14.2 \times 2.98 = 42.316\) kg per refill | Derived from the two rows above |
| Car — petrol | 0.171 | kg CO2e per km | Scope 1 — tailpipe emissions of a typical petrol car | Indicative average car; diesel, CNG and EV options in the tool use their own factors |
| Two-wheeler | 0.045 | kg CO2e per km | Scope 1 — motorcycle or scooter tailpipe | Indicative national average; subject to revision |
| Bus / metro | 0.028 | kg CO2e per passenger-km | Scope 3 — public transport, per passenger | Indicative average; varies with occupancy and city |
| Domestic flight | ≈ 250 | kg CO2e per return trip | Scope 3 — one typical domestic return journey | Indicative average trip; international long-haul is far higher |
| Diet — vegetarian | 1,000 | kg CO2e per person per year | Scope 3 — food production allowance | Indicative category average; subject to revision |
| Diet — egg-inclusive vegetarian | between 1,000 and 1,500 | kg CO2e per person per year | Scope 3 — intermediate between vegetarian and occasional non-veg | Indicative category average; use the tool's own value |
| Diet — occasional non-vegetarian | ≈ 1,500 | kg CO2e per person per year | Scope 3 — meat/fish a few times a week | Indicative category average; subject to revision |
| Diet — daily non-vegetarian | 1,900 | kg CO2e per person per year | Scope 3 — meat or fish most days | Indicative category average; subject to revision |
| Other goods, services and waste | 400 | kg CO2e per person per year | Scope 3 — clothing, electronics, services, household waste, water | Flat indicative allowance; does not vary with spending |
Because every factor above is a national average, the result is an estimate of the order of magnitude and of the relative size of each bucket — not a measured, state-specific or audited value.
Footprint Across Typical Indian Households
Five realistic profiles, each computed with the factors in the table above. Household totals are \((E + T + F + O)/1000\) tonnes; the per-person column divides that total by the number of members.
| Profile | Electricity (kWh/mo) | LPG cylinders/yr | Car km/mo (petrol) | Two-wheeler km/mo | Bus km/mo | Flights/yr | Diet | People | Household total (t CO2e/yr) | Per person (t CO2e/yr) |
|---|---|---|---|---|---|---|---|---|---|---|
| Single professional, metro flat, no vehicle | 120 | 4 | 0 | 0 | 600 | 1 | Occasional non-veg | 1 | 3.54 | 3.54 |
| Urban family with car and scooter | 350 | 8 | 600 | 300 | 100 | 2 | Occasional non-veg | 4 | 12.85 | 3.21 |
| Joint family, vegetarian, two-wheeler only | 400 | 10 | 0 | 500 | 400 | 0 | Vegetarian | 5 | 11.24 | 2.25 |
| Frequent-flyer professional, 6 return flights | 250 | 3 | 800 | 0 | 0 | 6 | Daily non-veg | 1 | 7.70 | 7.70 |
| Small-town family, no car, vegetarian | 150 | 6 | 0 | 400 | 200 | 0 | Vegetarian | 3 | 6.02 | 2.01 |
How row 2 reconciles with the formula
Urban family with car and scooter — 350 kWh/month, 8 cylinders/year, 600 car km/month, 300 two-wheeler km/month, 100 bus km/month, 2 flights, 4 people, occasional non-veg:
$$E = 12 \times 0.71 \times 350 + 8 \times 14.2 \times 2.98 = 2{,}982 + 338.5 = 3{,}320.5\ \text{kg}$$
$$T = 12\,(0.171 \times 600 + 0.045 \times 300 + 0.028 \times 100) + 250 \times 2 = 1{,}426.8 + 500 = 1{,}926.8\ \text{kg}$$
$$F + O = (1{,}500 + 400) \times 4 = 7{,}600\ \text{kg}$$
$$\text{Total} = \frac{3{,}320.5 + 1{,}926.8 + 7{,}600}{1000} = \frac{12{,}847.3}{1000} \approx 12.85\ \text{t CO}_2\text{e/yr}$$
Per person: \(12.85 \div 4 = 3.21\) t CO2e/yr.
What the comparison shows
- Large households look worse in total but better per person. The 5-person joint family emits 11.24 t — nearly as much as the car-owning family of four — yet only 2.25 t per person, because cooking, lighting and appliances are shared.
- Air travel is the sharpest lever. The frequent flyer's six return trips contribute 1.5 t, which alone is more than the entire vehicle footprint of the small-town family.
- Diet sets the floor. Even with zero travel and modest electricity use, the diet plus "other" allowance is 1.4 t per person for a vegetarian and 2.3 t for a daily non-vegetarian — so no household in this table can fall below roughly 1.5 t per person on these factors.
- Electricity is the biggest item you directly control. Cutting 350 kWh/month to 250 kWh/month saves \(12 \times 0.71 \times 100 = 852\) kg a year, about 0.85 t.
These profiles are illustrative constructions used to show how the formula behaves with Indian national-average factors, not survey data about real households.
FAQ
Why is the Indian grid factor so high? Coal still supplies most generation, so each kWh saved avoids roughly three-quarters of a kilogram of CO2e.
Does rooftop solar change the result? Yes indirectly: enter only the units you actually import from the grid.
How does this compare with the world? India averages about 1.9 tonnes per person against a global average near 4.7 tonnes.