What this calculator does
The Dairy Milk Production Calculator turns three everyday herd figures — how many cows are in milk, how much each one gives per day, and how many days they are milked — into a projected volume of milk for the whole period. It also converts that volume into kilograms and estimates the butterfat that the milk carries, which is what most processors actually pay on. The method is universal: it works with any breed, any housing system and any country, because it uses only your own measured numbers.
How to use it
Enter the number of milking (lactating) cows, excluding dry cows and heifers that have not calved. Enter the average daily yield per cow in litres — a bulk-tank average divided by cows in milk is the most reliable source. Then enter the number of milking days: use 305 for a standard lactation, 365 for a full year, or 30 for a monthly projection. Finally enter butterfat percentage from your last milk test, typically 3.5–4.2 percent for Holsteins and 4.5–5.5 percent for Jerseys.
The formula explained
Total production \(M\) is simply the product of herd size \(N\), daily yield per cow \(Y\) and milking days \(D\):
$$M = N \times Y \times D$$Weight follows from milk density, about 1.03 kg per litre, and butterfat \(F\) is a percentage of that weight:
$$\text{Fat (kg)} = M \times 1.03 \times \frac{F}{100}$$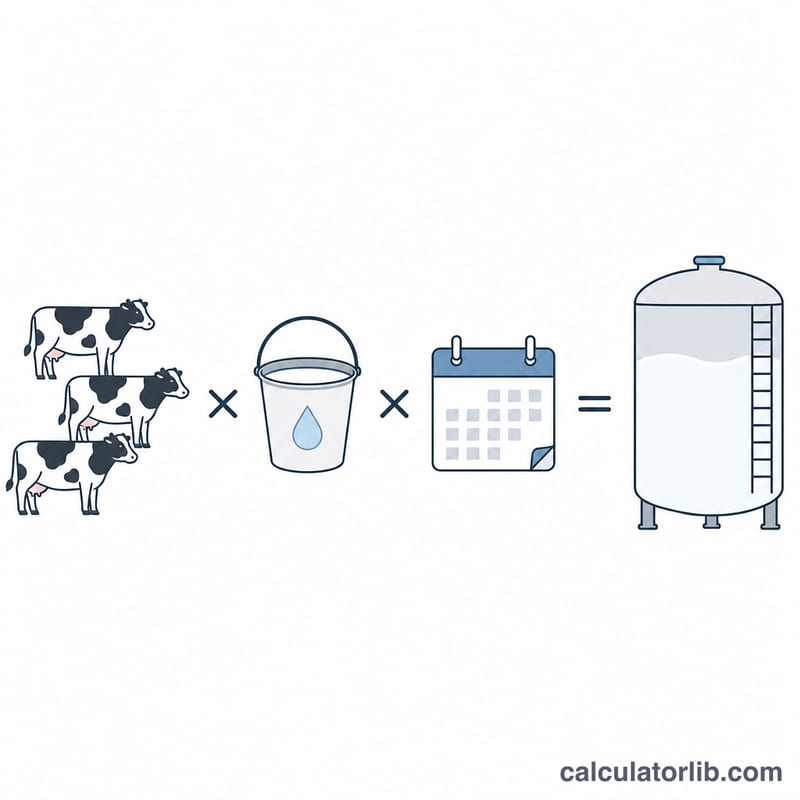
Worked example
A herd of 120 cows averaging 28 litres a day over a 305-day lactation at 3.8 percent butterfat:
$$M = 120 \times 28 \times 305 = 1{,}024{,}800\,\text{L}$$$$\text{Fat} = 1{,}024{,}800 \times 1.03 \times 0.038 = 40{,}110.7\,\text{kg}$$Daily herd output is \(120 \times 28 = 3{,}360\) litres, and each cow contributes \(28 \times 305 = 8{,}540\) litres over the lactation.
Typical Milk Yield and Butterfat by Breed
Daily yield per cow and butterfat percentage are the two inputs that most change the output of this calculator, and both depend heavily on breed. The table below gives broad, commonly reported herd-average ranges for the main dairy breeds, so you can sanity-check the yield_per_cow and fat_pct values you enter. Breeds differ in a predictable direction: Holsteins give the most volume at the lowest fat concentration, while Jersey and Guernsey give less volume at a much higher fat and protein concentration. That trade-off matters because milk sold on a component basis (fat and protein kilograms) can rank herds very differently from milk sold on volume.
| Breed | Typical daily yield (L/cow) | Typical 305-day lactation (L) | Butterfat (%) | Protein (%) |
|---|---|---|---|---|
| Holstein-Friesian | 28–34 | 8,500–11,000 | 3.5–3.9 | 3.0–3.3 |
| Jersey | 18–23 | 5,500–7,000 | 4.6–5.3 | 3.6–3.9 |
| Brown Swiss | 24–29 | 7,500–9,000 | 3.9–4.2 | 3.3–3.6 |
| Ayrshire | 20–25 | 6,300–8,000 | 3.9–4.2 | 3.2–3.5 |
| Guernsey | 18–23 | 5,500–7,000 | 4.4–5.0 | 3.4–3.7 |
| Montbéliarde | 22–27 | 6,800–8,500 | 3.8–4.1 | 3.3–3.6 |
| Crossbred (e.g. Holstein × Jersey) | 22–28 | 6,500–8,500 | 4.0–4.4 | 3.3–3.6 |
These are herd averages drawn from published breed-society and dairy-herd-improvement (DHI) recording summaries, not guarantees for an individual animal or an individual farm. Recorded herds in the United States, Canada and north-west Europe are usually at the upper end of these ranges because they are intensively fed and housed; pasture-based herds in Ireland, New Zealand, South America, South Asia and Africa commonly sit well below them, and the relevant national averages differ by a factor of several. Within one herd, output also varies with parity (first-lactation heifers typically produce roughly 70–80% of a mature cow), stage of lactation, ration energy density, heat stress and milking frequency (three-times-a-day milking typically adds roughly 10–15% over twice-a-day). Butterfat percentage is inversely related to yield within a cow and falls when the ration is low in effective fibre, so use your own bulk-tank test results when you have them rather than a breed figure.
Constants Used in This Calculation
The core calculation is deliberately simple — total milk is cow numbers multiplied by daily yield per cow multiplied by the number of milking days:
$$M = N \times Y \times D$$Everything beyond that volume figure (kilograms, butterfat kilograms, hundredweight) is produced by applying the fixed factors below.
| Constant | Value used | Notes |
|---|---|---|
| Milk density | ≈ 1.03 kg/L | Whole raw milk at about 20 °C. Real values run roughly 1.026–1.034 kg/L; density falls as fat rises and rises with solids-not-fat, so skimmed milk is slightly denser than whole milk. |
| Butterfat as a decimal | fat % ÷ 100 | 4.8% becomes 0.048. Butterfat is a mass fraction, so it is applied to the mass of milk, not the volume. |
| Standard lactation | 305 days | The international recording convention: a 305-day lactation followed by a roughly 60-day dry period. |
| Full year | 365 days | Used for whole-farm annual output where cows are replaced in the milking string as others dry off. |
| Month | 30 days | A convenient rounded month for cash-flow and haulage projections. |
| US hundredweight (cwt) | 1 cwt = 100 lb = 45.36 kg | Used only where milk is priced per hundredweight — principally the United States. |
Converting volume to mass and then to fat:
$$\text{Mass (kg)} = M_{\text{L}} \times 1.03 \qquad \text{Butterfat (kg)} = \text{Mass (kg)} \times \frac{\text{fat \%}}{100}$$Worked through for a 40-cow herd averaging 20 L/day over a 305-day lactation at 4.8% fat:
$$M = 40 \times 20 \times 305 = 244{,}000\ \text{L}$$ $$\text{Mass} = 244{,}000 \times 1.03 = 251{,}320\ \text{kg}$$ $$\text{Butterfat} = 251{,}320 \times 0.048 = 12{,}063\ \text{kg}$$For a US-style report that last mass figure would be quoted as 251,320 ÷ 45.36 ≈ 5,541 cwt.
Reporting conventions differ by country, so state your units. The United States reports milk in pounds (and prices it per hundredweight); Canada and much of continental Europe report in kilograms or in litres; the United Kingdom, Ireland, New Zealand and Australia most often report in litres. A "10,000" lactation therefore means very different things — 10,000 lb is only about 4,536 kg, roughly 4,400 L, whereas 10,000 L is about 10,300 kg or 22,700 lb. Because this calculator takes litres in and applies a single 1.03 kg/L density, its kilogram output is an estimate: if you have a measured bulk-tank density or your processor's own conversion factor, that measured value is more accurate than the constant used here.
Herd Scenarios Compared
Each row below applies the same formula, \(M = N \times Y \times D\), then converts to mass at 1.03 kg/L and multiplies by the fat fraction to get butterfat kilograms. The scenarios are chosen to show how herd size, breed-typical yield, fat concentration and the length of the accounting period interact — a small high-fat herd and a large high-volume herd can sit closer together on butterfat than their litre totals suggest.
| Scenario | Cows (N) | Yield (L/day, Y) | Days (D) | Total litres | Total kg (×1.03) | Fat % | Butterfat (kg) |
|---|---|---|---|---|---|---|---|
| Small Jersey herd, one lactation | 40 | 20 | 305 | 244,000 | 251,320 | 4.8 | 12,063 |
| Mid-size Holstein herd, one lactation | 120 | 28 | 305 | 1,024,800 | 1,055,544 | 3.8 | 40,111 |
| Large Holstein herd, full year | 300 | 32 | 365 | 3,504,000 | 3,609,120 | 3.6 | 129,928 |
| Same mid-size herd, 30-day projection | 120 | 28 | 30 | 100,800 | 103,824 | 3.8 | 3,945 |
| Brown Swiss herd, one lactation | 60 | 26 | 305 | 475,800 | 490,074 | 4.1 | 20,093 |
| Crossbred pasture herd, one lactation | 200 | 24 | 305 | 1,464,000 | 1,507,920 | 4.2 | 63,333 |
The 40-cow Jersey row works out as \(40 \times 20 \times 305 = 244{,}000\) L, which is 251,320 kg and 12,063 kg of butterfat. The 120-cow Holstein herd produces about 4.2 times the volume but only about 3.3 times the butterfat, because its fat test is roughly a fifth lower — the gap a component-based milk price would capture and a flat per-litre price would not.
Two cautions when reading these figures. First, the model assumes every cow in the herd milks every one of the days entered; a real herd has cows drying off, calving and occasionally being culled, so for a whole-year figure enter the average number of cows in milk rather than the total head count, and use a whole-herd average daily yield rather than a peak-yield figure. Peak yield can be 25–40% above the lactation average, so entering it is the single most common way to overstate output. Second, the 30-day row is a linear projection: it is accurate for a short horizon on a herd with a steady calving pattern, but in a seasonal-calving system output varies enormously month to month and a flat 30-day projection will be wrong in both directions across the year. Where the resulting numbers feed into contracts, quota positions or financing, check them against your own recorded bulk-tank deliveries and your processor's stated conversion and component standards.
FAQ
Should I include dry cows? No. Count only cows currently being milked, otherwise the average yield per cow is diluted and the total falls short.
Why is my real bulk tank volume lower? Calf feeding, milk discarded during antibiotic withdrawal, and spillage typically remove 2–5 percent of gross production.
Can I work in kilograms instead of litres? Yes — enter kilograms as the daily yield and read the litre output as kilograms; only the weight row, which applies the 1.03 density factor, would then need to be ignored.