What this calculator does
The Milk Supply Calculator compares how much breast milk you produce in a day with how much milk your baby is likely to need. It turns two familiar numbers - the average volume you express per session and how many sessions you do per day - into a daily total, then measures that total against a weight- and age-based intake estimate. The output is a coverage percentage, a surplus or shortfall in millilitres, and a target volume per session.
How to use it
Enter your baby's current weight in kilograms and age in months, then the typical volume you get from one pumping or nursing session and how many sessions you fit into 24 hours. Use an average over several days rather than your best single session, because output varies with time of day, hydration and rest.
The formula
Daily need \(D\) is the baby's weight \(W\) (kg) times an age-based intake factor \(F\) (mL/kg/day), capped at 788 mL/day; daily supply \(S\) is the volume per session \(V\) times the sessions per day \(N\):
$$D = \min(W \times F,\ 788), \qquad S = V_{\text{session}} \times N, \qquad \text{Coverage} = \frac{S}{D} \times 100\%$$\(F\) is \(126\) mL/kg/day below 6 months, \(107\) at 6–11 months and \(61\) from 12 months — average breast-milk intakes measured in breastfed babies (Rios-Leyvraz and Yao, 2023). The 788 mL/day cap is the average 24-hour intake of exclusively breastfed babies aged 1–6 months (Kent et al., 2006): intake stays about the same while the baby grows, so a heavier baby is not given an inflated need.
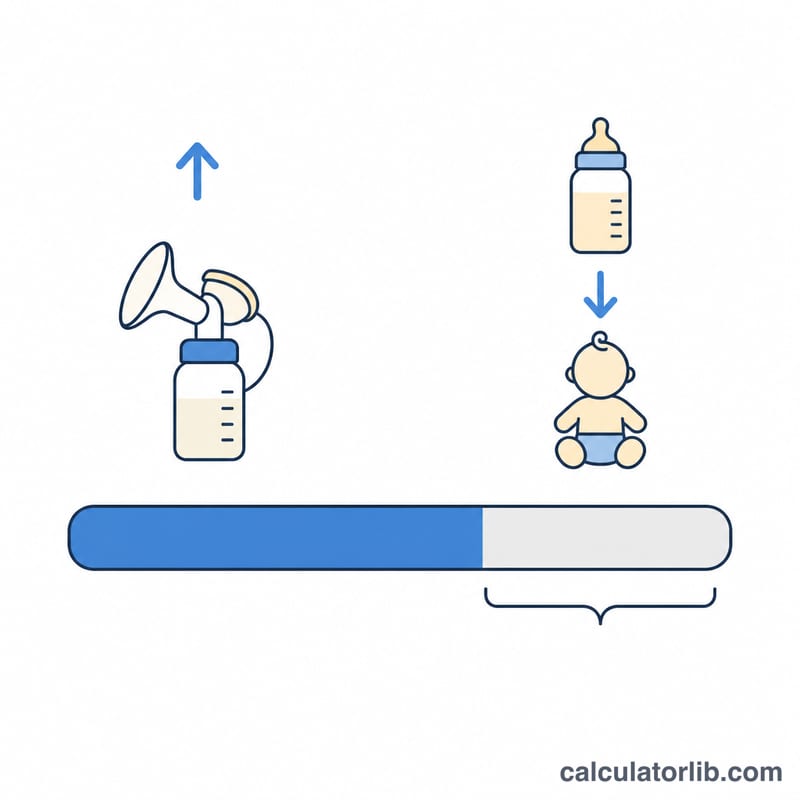
These figures are population averages. Healthy weight gain, wet diapers and a contented baby matter more than any single number. Pump output is usually lower than what a baby removes at the breast, so a shortfall on paper does not always mean low supply. Talk to a lactation consultant or paediatrician about your own situation.
Worked example
A 4-month-old weighing 7.5 kg, with 110 mL expressed across 6 sessions a day:
$$W \times F = 7.5 \times 126 = 945 \;\Rightarrow\; D = 788\,\text{mL/day}$$$$S = 110 \times 6 = 660\,\text{mL/day}$$$$\text{Coverage} = \frac{660}{788} \times 100 \approx 83.8\%$$That is a shortfall of \(660 - 788 = -128\) mL/day, and the target per session would be \(788 / 6 \approx 131\) mL.
Interpreting Your Coverage Result
The calculator compares two numbers: your estimated daily supply \(S = V \times N\) (millilitres per pumping session × sessions per day) and an estimated daily need \(D = W \times F\) (baby weight in kg × an age-based intake factor in mL/kg/day). Coverage is simply how much of that estimated need your pumped output covers:
$$\text{Coverage} = \frac{S}{D} \times 100\% \qquad \text{Surplus} = S - D$$
What the bands mean
- Coverage ≥ 100% — your measured output meets or exceeds the population-average estimate for a baby of that weight and age. A surplus of a few hundred mL per day is common for parents who pump on a fixed schedule and is usually stored or donated rather than consumed.
- Coverage 80–99% — output is close to the estimate. Because the intake factor is a midpoint of a wide normal range, a result in this band is generally indistinguishable from "fully adequate" and does not by itself indicate a problem.
- Coverage below 80% — the estimate suggests a gap. This is a reason to look at objective feeding markers and, if they also look off, to talk to a clinician or lactation consultant — not a reason to conclude that supply is insufficient.
Why a shortfall is not a diagnosis
A shortfall here is a gap against a population-average estimate, not a measurement of your baby. Two limitations matter most:
- Pumped volume underestimates breast removal. A pump responds to suction and cycling, not to a baby's tongue, jaw and latch, and it does not trigger let-down the same way. A directly breastfeeding baby frequently removes more milk per session than the same parent pumps, so a nursing baby's real intake can exceed the supply figure you entered.
- The intake factor is an average. The factors come from measured intakes of breastfed babies, and healthy intakes vary widely — from 478 to 1356 mL/day among exclusively breastfed babies aged 1–6 months (Kent et al., 2006). As a practical rule, results within about ±20% of 100% coverage fall inside ordinary variation and should not be read as a precise surplus or deficit.
Markers that actually indicate adequate intake
Guidance from the World Health Organization and, in the United States, the American Academy of Pediatrics points to observable signs rather than volumes:
- Weight gain tracking along a growth curve — steady progress along the baby's own percentile channel on a WHO growth standard chart, with weight regained to birth weight by about 2 weeks.
- At least 6 wet diapers per day after day 5 of life, with pale, dilute urine.
- Regular stools — frequent, soft, yellow stools in the early weeks, following the expected transition from meconium.
- Alert, responsive behaviour between feeds and audible swallowing during feeding.
If those markers look good, a coverage figure under 100% usually reflects pump performance or schedule, not your baby's nutrition. If the markers look poor, low coverage adds context — but the markers, not this number, are what should prompt action.
This tool is general information for planning and tracking only. It is not medical advice, not a diagnosis, and not a substitute for care from a paediatrician, midwife or lactation consultant. Never change a feeding plan, add supplementation or restrict feeds based on a calculator result alone.
Milk Intake Factors by Age
The factors are average breast-milk intakes per kilogram measured in breastfed babies. They fall with age because intake per kilogram declines and, from about 6 months, complementary foods supply part of the energy. Every band is capped at 788 mL/day.
| Age band | Factor \(F\) (mL/kg/day) | Measured average intake |
|---|---|---|
| 0–5 months | 126 | 624 mL/day at 1 month, 735 mL/day at 3 months |
| 6–11 months | 107 | 729 mL/day at 6 months |
| 12+ months | 61 | 593 mL/day at 12 months |
Sources: Rios-Leyvraz M, Yao Q. The volume of breast milk intake in infants and young children: a systematic review and meta-analysis. Breastfeed Med 2023 (doi:10.1089/bfm.2022.0281); Kent JC et al. Pediatrics 2006;117:e387 (doi:10.1542/peds.2005-1417) — exclusively breastfed babies aged 1–6 months took 788 mL/day on average (range 478–1356 mL). Formula-feeding guides often quote 150 mL/kg/day; that figure is not used here because breastfed intake does not keep rising with weight.
Coverage Across Common Scenarios
Each row uses \(D = \min(W \times F,\ 788)\) and \(S = V \times N\).
| Baby weight (kg) | Age (months) | Factor \(F\) | mL per session × sessions/day | Daily need \(D\) | Daily supply \(S\) | Coverage | Surplus / shortfall |
|---|---|---|---|---|---|---|---|
| 3.5 | 1 | 126 | 60 × 8 | 441 mL/day | 480 mL/day | 109% | +39 mL/day |
| 4.0 | 2 | 126 | 125 × 6 | 504 mL/day | 750 mL/day | 149% | +246 mL/day |
| 5.0 | 3 | 126 | 90 × 7 | 630 mL/day | 630 mL/day | 100% | 0 mL/day |
| 8.0 | 4 | 126 | 120 × 6 | 788 (cap) mL/day | 720 mL/day | 91% | −68 mL/day |
| 8.0 | 7 | 107 | 130 × 5 | 788 (cap) mL/day | 650 mL/day | 82% | −138 mL/day |
| 9.5 | 12 | 61 | 150 × 3 | 579.5 mL/day | 450 mL/day | 78% | −129.5 mL/day |
Use the rows as calibration, not as targets: whether a baby is getting enough is judged from weight gain, wet diapers and stools, and by a health professional.
FAQ
Is the intake factor exact? No. It is an average of measured intakes, and healthy babies vary widely, so treat the result as a midpoint rather than a quota.
My pump output is low - is my supply low? Not necessarily. Most babies remove milk more efficiently than a pump, so exclusively nursing parents often measure a shortfall that does not exist.
What if coverage is far below 100%? Check weight gain, wet and dirty diapers, and feeding cues first, then ask a lactation consultant about session frequency, latch and pump fit. This tool is an estimate, not medical advice.