What this calculator does
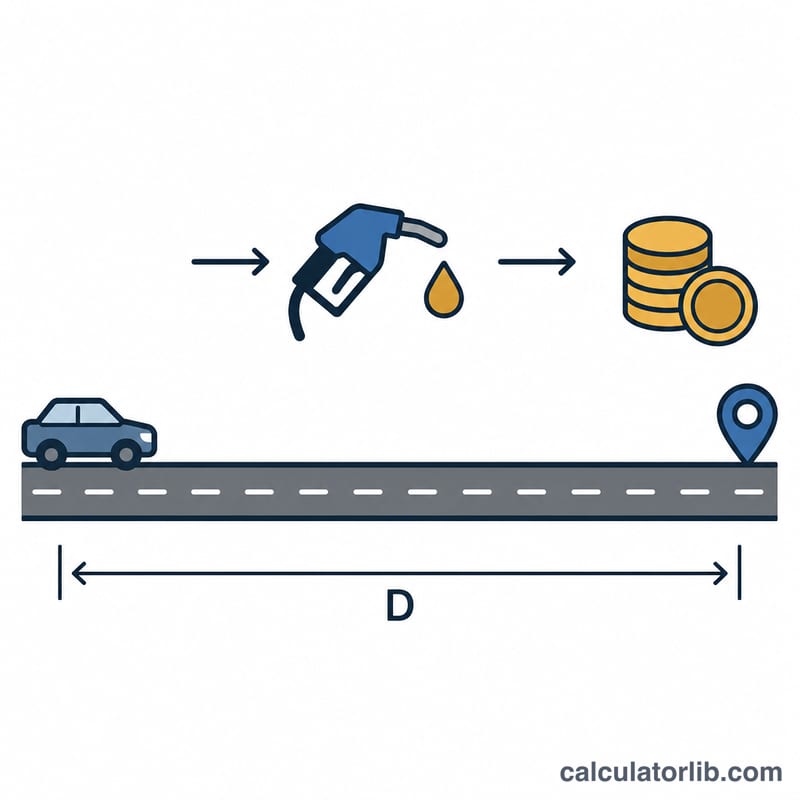
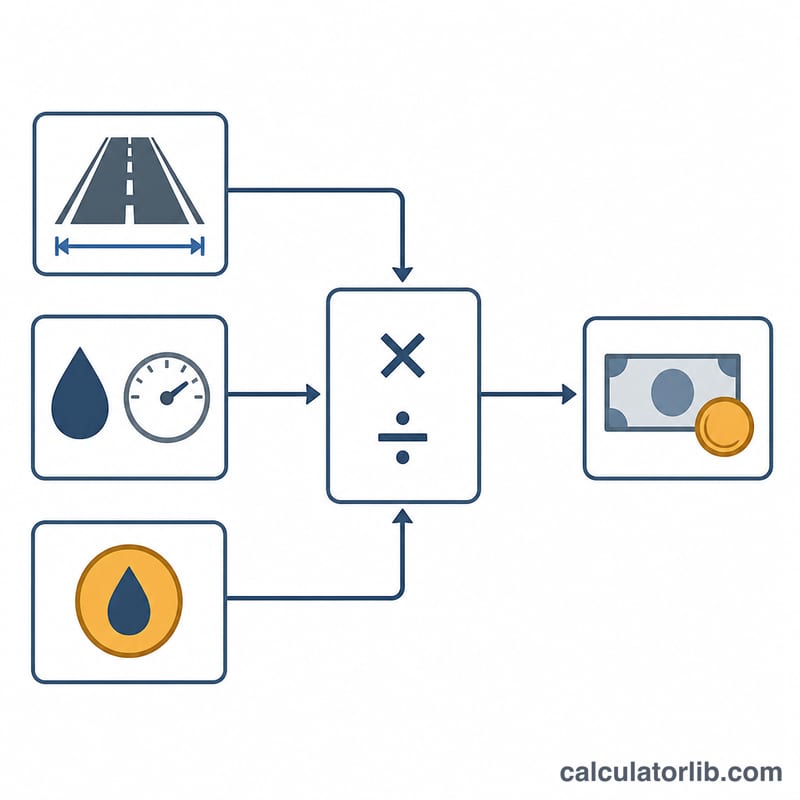
The Fuel Consumption Cost Calculator turns three numbers you already know — how far you are driving, how thirsty your vehicle is, and what fuel costs — into the amount of money the journey will actually take out of your wallet. It works with metric and imperial inputs, so you can enter kilometres with litres per 100 km, or miles with miles per US or Imperial gallon, and price fuel per litre or per gallon. The calculation is pure arithmetic and unit conversion, so it applies in any country and any currency.
How to use it
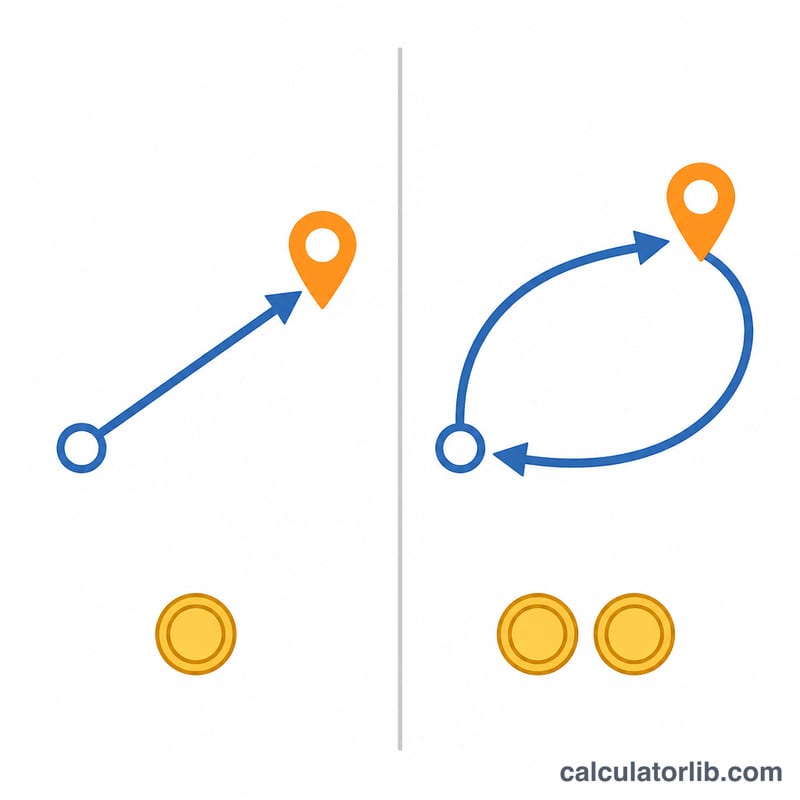
Enter the one-way distance and pick its unit. Enter your vehicle efficiency together with the unit shown on your dashboard or spec sheet. Enter the pump price and say whether that price is per litre or per gallon. Finally choose one way or round trip — round trip simply doubles the distance. The result shows total cost, litres and gallons burned, cost per kilometre or mile, and your consumption normalised to litres per 100 km so you can compare vehicles fairly.
The formula
Everything is converted to kilometres, litres per 100 km \(C\), and price per litre \(P\). With trip distance \(D\) in kilometres the fuel volume \(V\) and cost are:
$$V = \frac{ D \times C }{100} \qquad \text{Cost} = V \times P$$Miles become kilometres with \(1\,\text{mi} = 1.609344\,\text{km}\), and one US gallon is \(3.785411784\) litres.
Worked example
A 500 km one-way drive in a car that uses 8 L/100 km, with fuel at 1.60 per litre:
$$V = \frac{500 \times 8}{100} = 40\,\text{L} \qquad \text{Cost} = 40 \times 1.60 = 64.00$$That is 0.128 per kilometre. Making it a round trip doubles both figures to 80 litres and 128.00.
Fuel Efficiency and Unit Conversion Table
Fuel efficiency is expressed in different units around the world: litres per 100 kilometres (L/100 km) in most of Europe and much of Asia, kilometres per litre (km/L) in countries such as Japan and India, miles per US gallon (US MPG) in the United States, and miles per Imperial gallon (Imp MPG) in the United Kingdom. Because a US gallon and an Imperial gallon are different volumes, the same car has two different MPG figures depending on which gallon is meant.
Exact conversion factors
| Quantity | Exact equivalence |
|---|---|
| Mile → kilometre | 1 mi = 1.609344 km (exact) |
| US gallon → litre | 1 US gal = 3.785411784 L (exact) |
| Imperial gallon → litre | 1 Imp gal = 4.54609 L (exact) |
| Imperial gallon → US gallon | 1 Imp gal ≈ 1.20095 US gal |
Efficiency conversion formulas
The three working formulas used to normalise any efficiency input into L/100 km are:
$$\text{L/100 km} = \frac{235.215}{\text{US MPG}}, \qquad \text{L/100 km} = \frac{282.481}{\text{Imp MPG}}, \qquad \text{L/100 km} = \frac{100}{\text{km/L}}$$The constants come directly from the exact factors above: \(100 \times 3.785411784 \div 1.609344 = 235.215\) and \(100 \times 4.54609 \div 1.609344 = 282.481\). All three relationships are reciprocal, so the same formulas run in reverse (for example, US MPG = 235.215 ÷ L/100 km).
Side-by-side efficiency values
| L/100 km | km/L | US MPG | Imp MPG |
|---|---|---|---|
| 4 | 25.00 | 58.8 | 70.6 |
| 5 | 20.00 | 47.0 | 56.5 |
| 6 | 16.67 | 39.2 | 47.1 |
| 8 | 12.50 | 29.4 | 35.3 |
| 10 | 10.00 | 23.5 | 28.2 |
| 12 | 8.33 | 19.6 | 23.5 |
| 15 | 6.67 | 15.7 | 18.8 |
Note the scale is non-linear: the gap between 4 and 5 L/100 km is worth about 11.8 US MPG, while the gap between 12 and 15 L/100 km is worth only about 3.9 US MPG. Equal MPG steps are not equal fuel savings.
Price per volume
Fuel prices follow the same volume factors, so a price quoted per litre converts as:
$$p_{\text{US gal}} = p_{\text{litre}} \times 3.785411784, \qquad p_{\text{Imp gal}} = p_{\text{litre}} \times 4.54609$$| Price per litre | Price per US gallon | Price per Imperial gallon |
|---|---|---|
| 1.20 | 4.542 | 5.455 |
| 1.50 | 5.678 | 6.819 |
| 1.60 | 6.057 | 7.274 |
| 2.00 | 7.571 | 9.092 |
The price figures are shown without a currency symbol because the conversion is purely volumetric — the same multipliers apply to any currency. Enter the price in whatever currency and volume unit your pump displays, and select the matching price unit in the calculator.
Trip Cost Across Common Scenarios
The table below applies the trip-cost formula to four broad vehicle categories over three trip lengths. All rows use a single illustrative fuel price of 1.60 per litre and one-way distances. The prices are illustrative and currency-neutral — they are not the price in any particular country, and you should substitute your own local pump price.
The underlying calculation for every row is:
$$\text{Cost} = \frac{D \times E}{100} \times p$$where \(D\) is distance in kilometres, \(E\) is consumption in L/100 km and \(p\) is the price per litre.
| Vehicle example | Efficiency | Trip | Litres burned | Total cost @ 1.60/L | Cost per km |
|---|---|---|---|---|---|
| Small hatchback | 5 L/100 km | 100 km | 5.0 L | 8.00 | 0.080 |
| Small hatchback | 5 L/100 km | 500 km | 25.0 L | 40.00 | 0.080 |
| Small hatchback | 5 L/100 km | 1,000 km | 50.0 L | 80.00 | 0.080 |
| Family sedan | 7 L/100 km | 100 km | 7.0 L | 11.20 | 0.112 |
| Family sedan | 7 L/100 km | 500 km | 35.0 L | 56.00 | 0.112 |
| Family sedan | 7 L/100 km | 1,000 km | 70.0 L | 112.00 | 0.112 |
| Mid-size SUV | 10 L/100 km | 100 km | 10.0 L | 16.00 | 0.160 |
| Mid-size SUV | 10 L/100 km | 500 km | 50.0 L | 80.00 | 0.160 |
| Mid-size SUV | 10 L/100 km | 1,000 km | 100.0 L | 160.00 | 0.160 |
| Van / light truck | 14 L/100 km | 100 km | 14.0 L | 22.40 | 0.224 |
| Van / light truck | 14 L/100 km | 500 km | 70.0 L | 112.00 | 0.224 |
| Van / light truck | 14 L/100 km | 1,000 km | 140.0 L | 224.00 | 0.224 |
Worked substitution for the SUV over 1,000 km:
$$\text{Cost} = \frac{1000 \times 10}{100} \times 1.60 = 100 \times 1.60 = 160.00$$Because cost per km depends only on efficiency and price, it stays constant down each vehicle block — the trip length scales the litres and the total, not the rate. Selecting round trip in the calculator simply doubles the distance, so a 500 km round trip in the sedan costs 2 × 56.00 = 112.00.
Price sensitivity: the same 500 km trip at three fuel prices
| Vehicle | Litres for 500 km | @ 1.20/L | @ 1.60/L | @ 2.00/L |
|---|---|---|---|---|
| Small hatchback (5 L/100 km) | 25.0 L | 30.00 | 40.00 | 50.00 |
| Family sedan (7 L/100 km) | 35.0 L | 42.00 | 56.00 | 70.00 |
| Mid-size SUV (10 L/100 km) | 50.0 L | 60.00 | 80.00 | 100.00 |
| Van / light truck (14 L/100 km) | 70.0 L | 84.00 | 112.00 | 140.00 |
Cost is strictly proportional to price: a 67% price increase from 1.20 to 2.00 raises every trip cost by 67%. The absolute impact, however, grows with consumption — the same price move adds 20.00 to the hatchback trip but 56.00 to the van trip. Again, the 1.20 / 1.60 / 2.00 figures are illustrative placeholders in an unspecified currency, chosen only to show the shape of the relationship.
Interpreting Your Result
Total trip cost
The headline figure is the value of the fuel burned over the distance entered, at the price entered. It is a fuel-only number. It does not include tolls, parking, ferry or congestion charges, tyre and brake wear, servicing, oil, insurance, road tax or depreciation, all of which also accrue with distance. A trip's full economic cost is therefore always higher than the figure shown.
Cost per kilometre or per mile
Dividing the total by the distance gives the marginal running cost in fuel terms. This is the figure most directly comparable with per-distance mileage reimbursement rates and with per-distance allowances quoted by employers or tax authorities — although such official rates are usually intended to cover wear and depreciation as well as fuel, so they are normally higher than the fuel-only rate. The same figure is what is typically divided among passengers when a journey's cost is split, and what is compared between two vehicles or two routes.
Litres (or gallons) burned
The volume figure indicates how much fuel the journey consumes relative to the vehicle's tank capacity. If the volume exceeds usable tank capacity, at least one refuelling stop is required; dividing the trip volume by the tank size gives the approximate number of tankfuls. Usable capacity is normally less than nominal capacity, since the low-fuel warning and reserve leave part of the tank unused in practice.
Normalised L/100 km
Whatever efficiency unit is entered — km/L, US MPG or Imperial MPG — the calculation converts it internally to litres per 100 km using \(100/(\text{km/L})\), \(235.215/\text{US MPG}\) or \(282.481/\text{Imp MPG}\). This normalised value is the one to compare against manufacturer or regulator figures: WLTP combined consumption in the European Union, the United Kingdom and several other WLTP-adopting markets is published in L/100 km, while the United States EPA publishes combined city/highway ratings in US MPG, which converts to the same scale.
Direction of the scales
The units run in opposite directions, which is a common source of confusion:
- L/100 km — fuel per fixed distance. Lower is better. 5 L/100 km is more efficient than 9 L/100 km.
- km/L, US MPG, Imp MPG — distance per fixed fuel volume. Higher is better. 47 US MPG is more efficient than 26 US MPG.
Because the two scales are reciprocals, equal steps on one are not equal steps on the other. Going from 6 to 5 L/100 km saves 1 litre per 100 km; going from 15 to 14 L/100 km saves the same litre, yet the first change is worth about 7.9 US MPG and the second only about 1.1 US MPG.
Official figures versus real driving
Consumption measured in ordinary use is typically higher than official test-cycle values. Test procedures such as WLTP and the EPA cycles are run under standardised conditions, and real journeys differ in ways that raise consumption: cold starts and short trips, sustained high speed, hard acceleration, headwind, rain and snow, gradients, altitude, roof boxes and towing, low tyre pressure, extra load, air conditioning and heating use, and idling in traffic. For that reason the most accurate input for this calculator is your own measured consumption — total fuel added divided by distance covered between two brim-full refuellings — rather than the brochure number. If you use the official figure, the result should be read as a lower bound on the likely cost.
Fuel prices this week: United States
Average retail prices of regular gasoline and diesel across the United States, week of 2026-11-09, taxes included, as published by the U.S. Energy Information Administration. Use them as the fuel price in the calculator above.
- Regular gasoline (2026-11-09)
- $3.995/gal +30.7% since 2025-11-10
- Diesel (2026-11-09)
- $6.127/gal +59.7% since 2025-11-10
World crude oil prices, October 2026
World market prices of crude oil in U.S. dollars per barrel, monthly averages from the World Bank. These are commodity prices, not pump prices: the price at the pump also includes refining, distribution and taxes, and it differs from country to country.
- Crude oil, average of Brent, Dubai and WTI (2026-10)
- $108.50/bbl +72.2% since 2025-10
- Brent (2026-10)
- $125.00/bbl +93.2% since 2025-10
- WTI (2026-10)
- $97.70/bbl +62.3% since 2025-10
- Dubai (2026-10)
- $102.70/bbl +59.7% since 2025-10
Pump prices in the EU, week of 2026-11-09
Pump prices of petrol (Euro-super 95) and diesel by EU country, week of 2026-11-09, taxes included. Use them as the fuel price in the calculator above.
- EU average (petrol)
- 1.877 €/L
| Country | Petrol 95 (€/L) | Diesel (€/L) |
|---|---|---|
| Denmark | 2.391 | 2.435 |
| Netherlands | 2.196 | 2.361 |
| Finland | 2.144 | 2.485 |
| France | 2.088 | 2.178 |
| Germany | 2.067 | 2.253 |
| Greece | 2.042 | 2.099 |
| Italy | 1.995 | 2.218 |
| Ireland | 1.958 | 2.119 |
| Portugal | 1.922 | 2.135 |
| Latvia | 1.846 | 2.083 |
| Romania | 1.844 | 2.033 |
| Belgium | 1.844 | 2.357 |
| Lithuania | 1.843 | 2.225 |
| Estonia | 1.805 | 2.084 |
| Croatia | 1.749 | 2.025 |
| Spain | 1.730 | 1.898 |
| Cyprus | 1.699 | 2.000 |
| Slovakia | 1.691 | 1.965 |
| Hungary | 1.673 | 1.985 |
| Austria | 1.670 | 2.087 |
| Czechia | 1.653 | 1.899 |
| Slovenia | 1.634 | 1.950 |
| Luxembourg | 1.627 | 1.987 |
| Bulgaria | 1.582 | 1.896 |
| Sweden | 1.437 | 1.954 |
| Poland | 1.384 | 1.753 |
| Malta | 1.340 | 1.210 |
Latest figure: 2026-11-09 Data last updated 2026-11-11 · current
Source: U.S. Energy Information Administration (EIA), Gasoline and Diesel Fuel Update Public domain (U.S. government work); World Bank, Commodity Markets (Pink Sheet), modified CC BY 4.0; © European Union, Weekly Oil Bulletin (European Commission) CC BY 4.0
Prices per litre are converted by CalculatorLib from the bulletin's prices per 1,000 litres. Changes over one year are computed by CalculatorLib.
Source details and methodology
- U.S. Energy Information Administration (EIA), Gasoline and Diesel Fuel Update — Weekly retail gasoline and diesel prices
- World Bank, Commodity Markets (Pink Sheet), modified — Commodity Markets (Pink Sheet), monthly prices
- © European Union, Weekly Oil Bulletin (European Commission)
FAQ
My car shows MPG — is that US or Imperial? North American vehicles report US MPG; UK figures are Imperial gallons, which are about 20% larger, so the same car looks more efficient in Imperial MPG.
Why is my real cost higher? Manufacturer consumption figures come from test cycles. City traffic, air conditioning, roof boxes, cold weather and high speeds all raise consumption, so use your own measured average for accuracy.
How do I measure my true consumption? Fill the tank, reset the trip meter, drive normally, then refill: divide the litres added by the distance travelled and multiply by 100 for L/100 km.