
What this calculator does
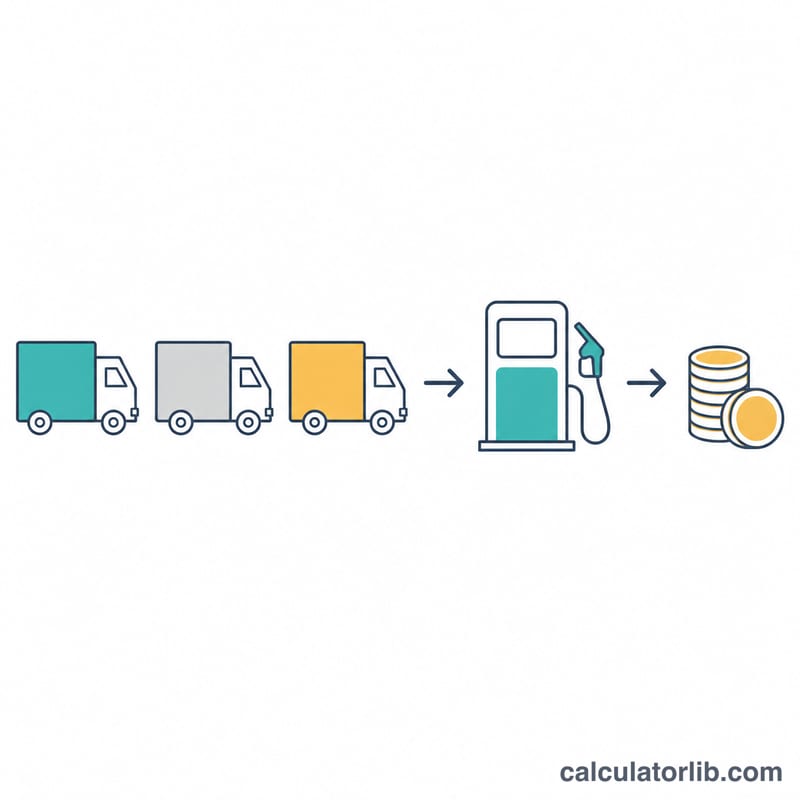
The Fleet Fuel Cost Calculator turns four simple inputs - how many vehicles you run, how far each one travels, how much fuel it burns and what that fuel costs - into a single budget figure. It also breaks the number down into cost per vehicle and cost per mile or kilometre, the two metrics fleet managers actually benchmark against. It works with miles and gallons (MPG) or kilometres and litres (km/L), and with any currency you choose.
How to use it
Pick your unit system first, because it controls how fuel efficiency and fuel price are interpreted. Then enter the fleet size, the distance a typical vehicle covers in the period you are budgeting for (a month, a quarter, a year), the average fuel efficiency from your telematics or fuel-card data, and the current pump price. If your fleet mixes vans and cars, run the calculator once per vehicle class and add the totals.
The formula
With \(n\) = number of vehicles, \(d\) = distance per vehicle, \(e\) = fuel efficiency and \(p\) = price per gallon or litre:
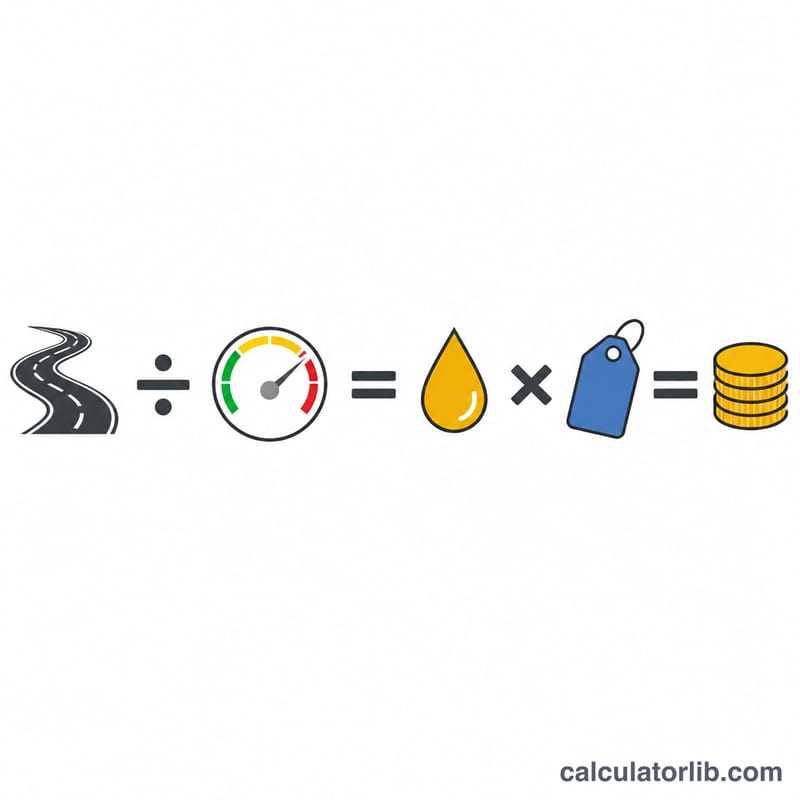
$$C = \frac{d}{e} \times p \times n$$The term \(\frac{d}{e}\) is the fuel each vehicle consumes. Dividing price by efficiency instead gives the cost per distance unit, \(c_{unit} = \frac{p}{e}\), which is the cleanest way to compare two vehicles that drive different amounts.
Worked example
A fleet of 10 vans each drives 25,000 miles a year at 20 MPG, with fuel at 3.50 per gallon:
$$\frac{25{,}000}{20} = 1{,}250\ \text{gallons per van}$$$$C = 1{,}250 \times 3.50 \times 10 = 43{,}750$$That is 4,375 per van, or 0.175 per mile. Raising average efficiency to 22 MPG would cut the bill to about 39,773 - a saving of nearly 4,000 from driver coaching and tyre pressure alone.
Interpreting Your Result
The calculator returns three related numbers, and each answers a different question.
- Total fleet fuel spend — the fuel bill for the whole fleet over the period your distance input covers. If you entered distance per vehicle per year, the total is an annual figure; if you entered a monthly distance, it is a monthly figure. The calculator has no concept of time — the period is whatever period your distance belongs to.
- Cost per vehicle — total spend divided by the number of vehicles. Because the model applies one average distance and one average efficiency to every unit, this is simply the cost of one \(\text{average}\) vehicle, not the cost of any specific van in your yard.
- Cost per mile (or per km) — fuel price divided by fuel efficiency. Note what is not in that expression: distance and vehicle count. Cost per distance unit is independent of how far you drive and how many vehicles you run.
That independence is why cost per mile is the benchmarking metric and total spend is the budgeting metric. Comparing two depots on total spend mostly compares how much work they did; comparing them on cost per mile compares how efficiently they burned fuel to do it. Use cost per mile to rank vehicles, routes, drivers and contract prices; use total spend to build the budget line and to size a fuel-card float.
What the number excludes
This is the fuel line only of total cost of ownership. It does not include maintenance and tyres, tolls and road-user charges, DEF/AdBlue, insurance, licensing, depreciation, telematics subscriptions, idling-related wear, or driver time. On a typical commercial fleet, fuel is a large slice of running cost but far from all of it, so never treat this figure as "the cost of running the fleet".
It also reflects exactly the price you type in. Pump prices in most countries already include fuel duty/excise and VAT or sales tax; some jurisdictions let registered businesses reclaim VAT or claim fuel tax credits, and bulk or fuel-card contracts are often quoted net of tax. Decide once whether you are budgeting in gross pump prices or net-of-reclaim prices, and keep every input on that same basis. The calculator is currency-agnostic — the output is in whatever currency your fuel price is in.
Sensitivity: three inputs are linear, one is not
Total cost scales proportionally with distance, fleet size and fuel price: double any one of them and the bill doubles. Efficiency behaves differently, because it sits in the denominator:
$$\text{Total Cost} = N \times \frac{d}{e} \times p$$
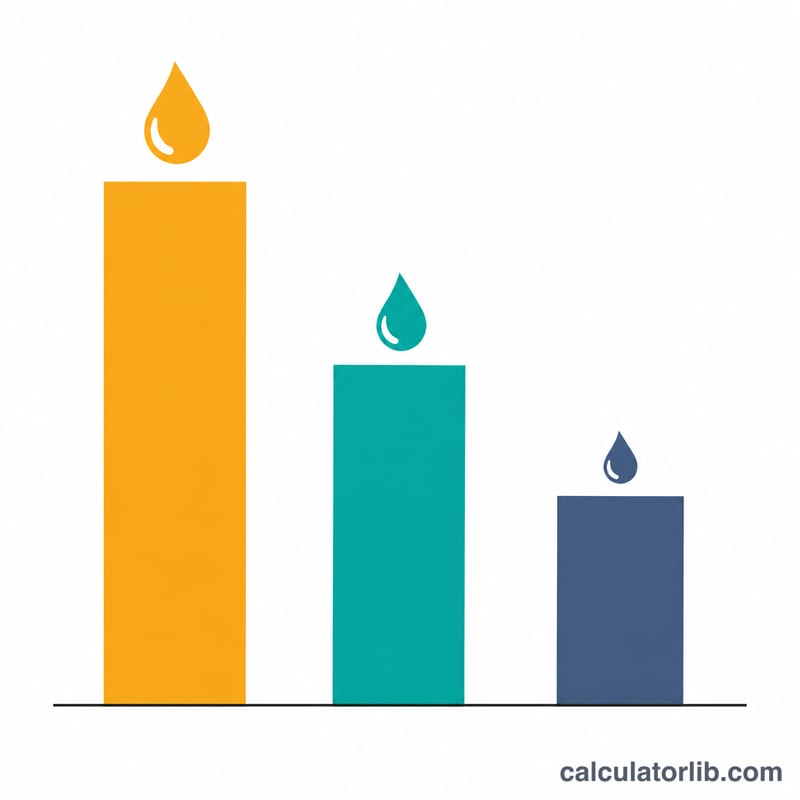
A gain in efficiency from \(e\) to \(1.10\,e\) multiplies cost by \(1/1.10 = 0.9091\), so a 10% efficiency improvement cuts fuel spend by about 9.1%, not 10%. Going the other way, a 10% efficiency loss raises spend by 11.1%. The asymmetry matters when you cost a driver-training or aerodynamics programme: efficiency gains are always worth slightly less than their headline percentage, and efficiency losses always cost slightly more.
A worked baseline: 10 vehicles, 25,000 miles each per year, 20 MPG, $3.50 per gallon gives 1,250 gallons per vehicle and a total of 43,750 dollars per year, at $0.175 per mile.
Accuracy limits
The output is only as good as the average efficiency you enter. Two cautions:
- Real-world efficiency is usually worse than the rated figure. Manufacturer and type-approval numbers (WLTP in Europe, EPA labels in the United States, and older NEDC figures, which were notably optimistic) are measured on standardised cycles. Urban stop-start work, payload, roof racks, cold weather, idling, terrain and speed all push real consumption higher. Fleet telematics or fuel-card data — litres or gallons actually dispensed divided by odometer distance — is a far better input than a brochure number.
- One average hides a mixed fleet. If your fleet spans 3.5 t vans and heavy trucks, or diesel and hybrid units, run the calculator separately per vehicle class and add the totals; a single blended MPG will misstate both groups.
Treat the result as a planning estimate. For budget approval, sanity-check it against last period's actual fuel invoices before you commit to it.
Fuel Efficiency and Unit Conversions
Fleet data arrives in whatever units the source market uses. These are the exact defined conversion constants — all four are exact by international definition, not rounded measurements.
| Quantity | Relationship |
|---|---|
| US liquid gallon | 1 US gal = 3.785411784 L (exact) |
| UK (imperial) gallon | 1 imp gal = 4.54609 L (exact) |
| Mile | 1 mile = 1.609344 km (exact) |
| Gallon ratio | 1 imp gal = 1.200950 US gal |
Efficiency conversions
| From → To | Formula |
|---|---|
| MPG (US) → km/L | \(\text{km/L} = \text{MPG(US)} \times 0.425144\) |
| km/L → MPG (US) | \(\text{MPG(US)} = \text{km/L} \times 2.352146\) |
| MPG (US) → MPG (imperial) | \(\text{MPG(imp)} = \text{MPG(US)} \times 1.201\) |
| MPG (US) → L/100 km | \(\text{L/100 km} = 235.215 \div \text{MPG(US)}\) |
| km/L → L/100 km | \(\text{L/100 km} = 100 \div \text{km/L}\) |
| MPG (imperial) → L/100 km | \(\text{L/100 km} = 282.481 \div \text{MPG(imp)}\) |
Price conversions
| From → To | Formula | Example |
|---|---|---|
| Per litre → per US gallon | \(p_{\text{US gal}} = p_{\text{L}} \times 3.785411784\) | 1.60/L → 6.06/US gal |
| Per litre → per imperial gallon | \(p_{\text{imp gal}} = p_{\text{L}} \times 4.54609\) | 1.60/L → 7.27/imp gal |
| Per US gallon → per litre | \(p_{\text{L}} = p_{\text{US gal}} \div 3.785411784\) | 3.50/US gal → 0.9246/L |
One efficiency, four units
A vehicle rated at 30 MPG (US) expressed every common way:
| MPG (US) | km/L | L/100 km | MPG (imperial) |
|---|---|---|---|
| 30.0 | 12.75 | 7.84 | 36.0 |
Substituting in full: \(30 \times 0.425144 = 12.754\) km/L; \(235.215 \div 30 = 7.84\) L/100 km, which matches \(100 \div 12.754 = 7.84\); and \(30 \times 1.201 = 36.0\) MPG(imp).
Note the direction of L/100 km: it is a consumption figure, so lower is better, while MPG and km/L are efficiency figures where higher is better. Halving L/100 km doubles MPG — the two scales are reciprocal, which is why averaging L/100 km values and averaging MPG values over the same fleet give different answers. For a fleet average, always divide total fuel by total distance rather than averaging the individual ratios.
The 20% gallon trap
The imperial gallon is about 20% larger than the US gallon (4.54609 L vs 3.785411784 L). This is the single most common error in mixed-market fleet data:
- A UK spec sheet quoting "40 MPG" is only 33.3 MPG(US). Enter 40 into a US-gallon calculation and you will understate fuel spend by roughly 17%.
- Conversely, a US "25 MPG" van is 30.0 MPG(imperial) — it did not suddenly get more efficient.
- The same trap hits prices and volumes: a per-gallon price from a UK invoice is per imperial gallon and must be divided by 4.54609, not 3.785, to reach a per-litre figure.
The safest habit for multinational fleets is to normalise everything to litres and kilometres at the point of data entry, run the numbers in metric, and convert only for presentation. Canada and most of Europe sell fuel by the litre; the United States sells by the US gallon; the United Kingdom sells by the litre but still quotes vehicle economy in imperial MPG — so UK data routinely mixes both systems in one record.
Fleet Fuel Cost Across Scenarios
Every row below starts from the same baseline and changes exactly one input, so the effect of each variable is isolated. Figures are illustrative and currency-agnostic (shown with $ for readability).
Baseline: 10 vehicles × 25,000 miles per vehicle per year, 20 MPG (US), $3.50 per US gallon → 1,250 gal per vehicle, 250,000 fleet miles, $43,750 total, $0.175 per mile.
| Scenario | Total spend / year | Cost per vehicle | Cost per mile | Change vs baseline |
|---|---|---|---|---|
| Baseline — 10 veh, 25,000 mi, 20 MPG, $3.50/gal | $43,750 | $4,375 | $0.1750 | — |
| Fuel price $3.00/gal | $37,500 | $3,750 | $0.1500 | −14.3% |
| Fuel price $4.50/gal | $56,250 | $5,625 | $0.2250 | +28.6% |
| Efficiency 16 MPG | $54,687.50 | $5,468.75 | $0.2188 | +25.0% |
| Efficiency 25 MPG | 35,000 | $3,500 | $0.1400 | −20.0% |
| Fleet size 5 vehicles | $21,875 | $4,375 | $0.1750 | −50.0% |
| Fleet size 25 vehicles | $109,375 | $4,375 | $0.1750 | +150.0% |
| Distance 15,000 mi/vehicle | $26,250 | $2,625 | $0.1750 | −40.0% |
| Distance 40,000 mi/vehicle | $70,000 | $7,000 | $0.1750 | +60.0% |
| Metric equivalent — 10 vans × 40,000 km, 8.5 km/L, $1.60/L | 75,294.12 | $7,529.41 | $0.1882 / km | n/a (metric) |
Reading the pattern
- Price and distance and fleet size are proportional. Price falls from $3.50 to $3.00 — a 14.3% cut — and spend falls by exactly 14.3%. Distance rises from 25,000 to 40,000 mi (+60%) and spend rises exactly 60%. Fleet size 10 → 25 is +150% in both. In all three cases the ratio in equals the ratio out.
- Efficiency is inverse. Moving 20 → 25 MPG is a 25% efficiency gain but only a 20% cost reduction \((1 - 20/25 = 0.20)\). Dropping 20 → 16 MPG is a 20% efficiency loss but a 25% cost increase \((20/16 - 1 = 0.25)\). Efficiency changes always "give back" less than their headline percentage and "take" more.
- Cost per mile ignores distance and fleet size. It stays at $0.1750 in every fleet-size and distance row, because \(\text{cost/mile} = p / e\). Only price and efficiency can move it — which is exactly why it is the metric to benchmark depots and vehicle classes on.
- Cost per vehicle ignores fleet size. It holds at $4,375 whether you run 5 or 25 vehicles, since the model assumes identical vehicles. It moves only with distance, price or efficiency.
The metric row, worked out
For the 10-van metric scenario, fuel per van is \(40{,}000 \div 8.5 = 4{,}705.88\) L, so cost per van is \(4{,}705.88 \times 1.60 = 7{,}529.41\) and the fleet total is \(10 \times 7{,}529.41 = 75{,}294.12\). Cost per km is \(1.60 \div 8.5 = 0.1882\). For reference, 8.5 km/L is about 20.0 MPG(US) and 11.76 L/100 km, and $1.60/L is about $6.06 per US gallon — so this van is roughly as efficient as the baseline vehicle, just fuelled at a much higher per-litre price, which is typical of European versus North American fuel markets.
Using the table for decisions
Compare the size of the levers before spending money on any of them. On this baseline, a 25% efficiency improvement across the fleet saves $8,750 per year — more than a 50-cent-per-gallon drop in pump price saves ($6,250), and it is a lever you can partly control through vehicle choice, tyre pressure, route planning, idle reduction and driver coaching. Cutting distance has the largest proportional effect of all, but usually means cutting revenue-generating work, so it is only a real lever where the miles are empty, duplicated or badly routed.
Fuel prices this week: United States
Average retail prices of regular gasoline and diesel across the United States, week of 2026-11-09, taxes included, as published by the U.S. Energy Information Administration. Use them as the fuel price in the calculator above.
- Regular gasoline (2026-11-09)
- $3.995/gal +30.7% since 2025-11-10
- Diesel (2026-11-09)
- $6.127/gal +59.7% since 2025-11-10
World crude oil prices, October 2026
World market prices of crude oil in U.S. dollars per barrel, monthly averages from the World Bank. These are commodity prices, not pump prices: the price at the pump also includes refining, distribution and taxes, and it differs from country to country.
- Crude oil, average of Brent, Dubai and WTI (2026-10)
- $108.50/bbl +72.2% since 2025-10
- Brent (2026-10)
- $125.00/bbl +93.2% since 2025-10
- WTI (2026-10)
- $97.70/bbl +62.3% since 2025-10
- Dubai (2026-10)
- $102.70/bbl +59.7% since 2025-10
Pump prices in the EU, week of 2026-11-09
Pump prices of petrol (Euro-super 95) and diesel by EU country, week of 2026-11-09, taxes included. Use them as the fuel price in the calculator above.
- EU average (petrol)
- 1.877 €/L
| Country | Petrol 95 (€/L) | Diesel (€/L) |
|---|---|---|
| Denmark | 2.391 | 2.435 |
| Netherlands | 2.196 | 2.361 |
| Finland | 2.144 | 2.485 |
| France | 2.088 | 2.178 |
| Germany | 2.067 | 2.253 |
| Greece | 2.042 | 2.099 |
| Italy | 1.995 | 2.218 |
| Ireland | 1.958 | 2.119 |
| Portugal | 1.922 | 2.135 |
| Latvia | 1.846 | 2.083 |
| Romania | 1.844 | 2.033 |
| Belgium | 1.844 | 2.357 |
| Lithuania | 1.843 | 2.225 |
| Estonia | 1.805 | 2.084 |
| Croatia | 1.749 | 2.025 |
| Spain | 1.730 | 1.898 |
| Cyprus | 1.699 | 2.000 |
| Slovakia | 1.691 | 1.965 |
| Hungary | 1.673 | 1.985 |
| Austria | 1.670 | 2.087 |
| Czechia | 1.653 | 1.899 |
| Slovenia | 1.634 | 1.950 |
| Luxembourg | 1.627 | 1.987 |
| Bulgaria | 1.582 | 1.896 |
| Sweden | 1.437 | 1.954 |
| Poland | 1.384 | 1.753 |
| Malta | 1.340 | 1.210 |
Latest figure: 2026-11-09 Data last updated 2026-11-11 · current
Source: U.S. Energy Information Administration (EIA), Gasoline and Diesel Fuel Update Public domain (U.S. government work); World Bank, Commodity Markets (Pink Sheet), modified CC BY 4.0; © European Union, Weekly Oil Bulletin (European Commission) CC BY 4.0
Prices per litre are converted by CalculatorLib from the bulletin's prices per 1,000 litres. Changes over one year are computed by CalculatorLib.
Source details and methodology
- U.S. Energy Information Administration (EIA), Gasoline and Diesel Fuel Update — Weekly retail gasoline and diesel prices
- World Bank, Commodity Markets (Pink Sheet), modified — Commodity Markets (Pink Sheet), monthly prices
- © European Union, Weekly Oil Bulletin (European Commission)
FAQ
Should I use annual or monthly distance? Either - the result simply covers whatever period the distance figure represents. Keep distance and budget period aligned.
My fleet is mixed. Is one average MPG enough? Averaging across very different vehicles understates cost, because heavy vehicles burn disproportionately more fuel. Group similar vehicles and run separate calculations.
Does this include tolls, maintenance or AdBlue? No. This is pure fuel spend, which is usually the largest single variable cost, but total cost of ownership also includes depreciation, insurance, tyres and servicing.