What Is the Snap Score Calculator?
Your Snapchat Snap Score is a single number that reflects how active you are on the app. It rises roughly in line with the snaps you send, the snaps you receive, and the stories you post. This calculator gives you a simple, transparent estimate of how your Snap Score could grow over a chosen period based on your typical daily habits.
Snapchat does not publish an exact scoring formula, so this tool uses the widely understood approximation that each tracked action adds about one point. It is intended as a fun, motivational projection rather than an official figure.
How to Use It
Enter your current Snap Score (visible on your profile), then estimate how many snaps you send and receive per day and how many stories you post daily. Pick how many days ahead you want to project. The calculator multiplies your daily activity by the number of days and adds it to your starting score.
The Formula Explained
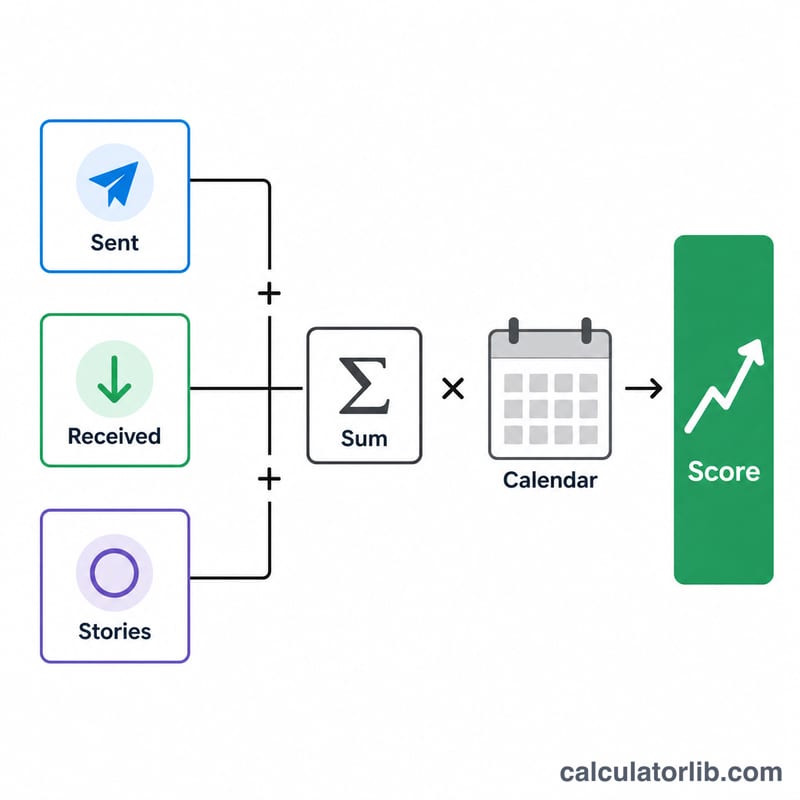
First we add up your daily actions to get a daily activity rate:
$$\text{Daily Activity} = \text{Snaps Sent} + \text{Snaps Received} + \text{Stories Posted}$$
Then we project forward:
$$\text{Projected Score} = \text{Current Score} + \text{Daily Activity} \times \text{Days}$$
Worked Example
Suppose your current score is 10,000. You send 20 snaps, receive 15, and post 2 stories each day. Your daily activity is \(20 + 15 + 2 = 37\) points. Over 30 days that adds \(37 \times 30 = 1{,}110\) points, projecting a score of \(10{,}000 + 1{,}110 = 11{,}110\), 11,110.
Snap Score Growth by Activity Level
Snapchat has never published the exact weighting behind the Snap Score, but the widely observed behaviour is that roughly one point is added for each snap you send, each snap you open, and each story you post. This calculator uses that simple model:
$$\text{Projected Score} = \text{Current Score} + \left(\text{Snaps Sent} + \text{Snaps Received} + \text{Stories Posted}\right) \times \text{Days}$$
The table below applies that model to four typical usage patterns, all starting from a base score of 10,000. The "daily activity points" column is simply sent + received + stories per day.
| Activity level | Daily pattern (sent / received / stories) | Daily activity points | Gain in 7 days | Gain in 30 days | Gain in 90 days | Gain in 365 days | Score after 1 year |
|---|---|---|---|---|---|---|---|
| Light user | 5 / 5 / 0 | 10 | 70 | 300 | 900 | 3,650 | 13,650 |
| Moderate user | 20 / 15 / 2 | 37 | 259 | 1,110 | 3,330 | 13,505 | 23,505 |
| Heavy user | 60 / 50 / 3 | 113 | 791 | 3,390 | 10,170 | 41,245 | 51,245 |
| Power user | 150 / 120 / 5 | 275 | 1,925 | 8,250 | 24,750 | 100,375 | 110,375 |
Two representative rows worked out in full. A moderate user over 30 days:
$$10{,}000 + (20 + 15 + 2) \times 30 = 10{,}000 + 37 \times 30 = 10{,}000 + 1{,}110 = 11{,}110$$
so the projected score after one month is 11,110. A heavy user over 90 days:
$$10{,}000 + (60 + 50 + 3) \times 90 = 10{,}000 + 113 \times 90 = 10{,}000 + 10{,}170 = 20{,}170$$
giving a projected score of 20,170.
All figures in this table are approximations produced by the ~1-point-per-action model. They assume perfectly steady daily activity, which almost never happens in practice, and they ignore any bonus points Snapchat may award. Treat them as a planning estimate and a way to compare activity levels against each other, not as a prediction of the exact number you will see in the app.
What Your Projected Snap Score Means
The projection is a lower bound, not a ceiling. The model counts one point per snap sent, per snap opened and per story posted. Several things that users have consistently observed are not captured: points reported for snaps that arrive but are never opened, sending one snap to several recipients at once (each recipient can count separately), a bonus when you send your first snap after a period of inactivity, and jumps that appear when Snapstreaks are maintained. Because of this, a real Snap Score usually climbs somewhat faster than the projection for the same level of activity.
The score only goes up. A Snap Score does not decrease over time and is not reset by inactivity — points already earned stay earned. So if your actual score a month from now is below the projection, it does not mean points were lost. It means your real daily activity was lower than the numbers you entered: fewer snaps sent, fewer opened, or days skipped entirely. Comparing projection to reality is therefore a useful check on whether your assumed daily rate was realistic.
Magnitude reflects cumulative activity, not popularity or age. A large score tells you that a lot of snapping has happened on that account in total — nothing more. It does not measure how many friends someone has, how interesting their content is, or how long the account has existed. A three-year-old account used twice a week will sit far below a six-month-old account used constantly. Reading social meaning into someone else's score is reading something the number does not contain.
The real algorithm is unpublished. Snapchat has never released the formula, the point values, or the update schedule, and scores are known to refresh in batches rather than instantly after every action. Everything here is reverse-engineered from user observation, so the output should be treated as an informal estimate — never as an official Snapchat figure, and never as evidence in any dispute about what someone has or has not been doing on the app.
Key Terms Explained
- Snap Score — the single number shown under your username on your Snapchat profile, next to your Snapcode. It is a running total of scored activity on the account and only increases.
- Snap sent — a photo or video message you send to one or more friends (not a text-only chat message). Enter your typical daily count in the snaps_sent field; it is the first term in the parentheses of the formula.
- Snap received — a snap another user sends you. Opening a received snap is what reliably registers a point; unopened snaps are widely reported to contribute too, which is one reason the projection tends to run low. Enter opened snaps per day in snaps_received.
- Story post — a snap you publish to your Story rather than sending directly, visible to your audience for 24 hours. Each post counts once regardless of how many people view it. This is the stories_posted field.
- Snapstreak — the flame icon and day count that appears when you and a friend each send at least one snap to the other on consecutive days. Streaks are not an input here, but maintaining them both guarantees daily sends and is associated with extra score movement, so streak-heavy users usually outrun the projection.
- Daily activity rate — the sum \(\text{snaps sent} + \text{snaps received} + \text{stories posted}\) for one day, i.e. the value inside the parentheses. It is the single number that drives how fast your score grows; doubling it doubles the projected gain.
- Current score — the score displayed on your profile right now, typed into current_score. It is the starting point the projected gain is added to and has no effect on the growth rate itself.
- Projection period (days) — how many days ahead you want to look, entered in days. The daily activity rate is multiplied by this number, so it is the other half of the gain calculation.
- Projected score — the calculator's output: current score plus daily activity rate multiplied by days. It is an estimate of where your score could stand if you keep up exactly the activity you described, and it assumes roughly one point per action.
FAQ
Is this the exact Snapchat formula? No. Snapchat keeps its scoring private. This is a well-known approximation that treats each snap and story as roughly one point.
Why did my real score jump more than predicted? Opening a snap, sending to multiple friends at once, maintaining streaks, or first-of-the-day bonuses can add extra points beyond a simple count.
Can the score go down? No — your Snap Score only increases or stays the same, so this tool always projects growth.