What this calculator does
A solar array is an upfront purchase that pays itself back in avoided electricity bills. This calculator estimates the repayment (payback) period — how long until cumulative bill savings equal what you actually paid — plus your total savings, net benefit and return on investment over the life of the system. It is currency-agnostic: the maths works with any currency you select.
How to use it
Enter the installed system cost, any upfront rebate or incentive you receive, and your current monthly electricity bill. Set the share of that bill solar will offset (100% for a system sized to cover all your consumption, less if you only cover part of it), the annual rate at which you expect electricity prices to rise, and the analysis period (25 years matches a typical panel warranty).
The formula
Let \(C\) = system cost, \(R\) = rebates, \(B\) = monthly bill, \(p\) = percent offset and \(g\) = annual price rise as a decimal. Net cost is \(C_{net} = C - R\) and first-year savings are \(S_1 = B \times 12 \times \frac{p}{100}\). The payback year solves:
$$n = \frac{\ln\left(1 + \frac{ g \times C_{net}}{S_1}\right)}{\ln(1+g)} \quad\text{and, if } g = 0,\quad n = \frac{C_{net}}{S_1}$$Lifetime savings over \(N\) years are \(S_1 \times \frac{(1+g)^N - 1}{g}\), and the net benefit is that total minus \(C_{net}\).
Worked example
A 20,000 system with a 5,000 rebate, a 200 monthly bill fully offset, flat prices and a 25-year horizon:
$$C_{net} = 20000 - 5000 = 15000 \qquad S_1 = 200 \times 12 \times 1 = 2400$$$$n = \frac{15000}{2400} = 6.25\ \text{years}$$Total savings are \(2400 \times 25 = 60000\), a net benefit of \(60000 - 15000 = 45000\) and an ROI of \(\frac{45000}{15000} \times 100 = 300\%\).
Interpreting Your Payback Period and ROI
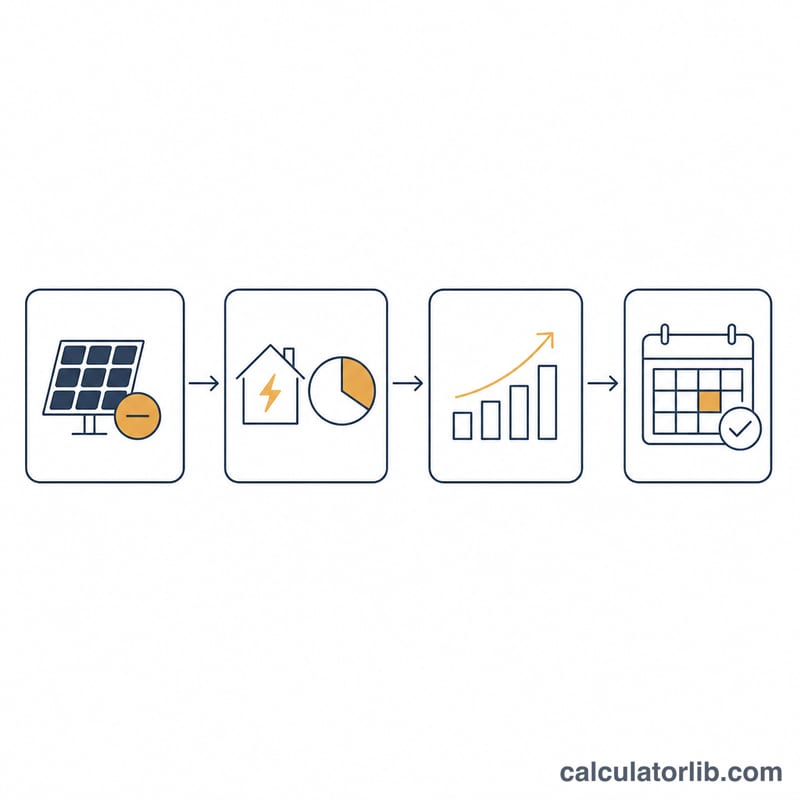
The calculator turns six inputs into four nominal cash figures. Each one answers a narrow question, and knowing exactly which question keeps you from over-reading the output.
What each output means
- Payback period — the number of years until cumulative bill savings, added up year by year, first equal the net cost after rebates. Internally the tool finds the first whole year \(k\) in which the running total reaches the net cost, then interpolates linearly inside that year: \(P_{\text{back}} = (k-1) + \dfrac{C - \sum_{n=1}^{k-1} S\,(1+g)^{\,n-1}}{S\,(1+g)^{\,k-1}}\). Savings are counted at face value in the year they occur — they are not discounted back to today. A payback of 5.81 years therefore means "nominal savings cross the net cost partway through year 6", not an internal rate of return (IRR) and not a net present value (NPV).
- Lifetime (total) savings — the sum \(T = \sum_{n=1}^{Y} S\,(1+g)^{\,n-1}\) over the whole analysis period. This figure assumes the escalation rate you entered holds in every single year of the horizon. Over 25 years that assumption dominates the result: the last year's saving is \((1+g)^{24}\) times the first year's, so a 3% entry makes year 25 about twice year 1, and a 6% entry makes it about four times year 1.
- Net benefit — simply \(T - C\), the surplus of counted savings over the net cost across the period. Negative means the array did not pay for itself inside the horizon you modelled.
- ROI — net benefit divided by net cost, expressed as a plain percentage: \(\text{ROI} = \dfrac{T - C}{C} \times 100\). This is a cumulative figure for the entire analysis period, not an annualised rate. In the baseline example below (net cost $15,000, $200 monthly bill fully offset, 3% escalation, 25 years) the ROI reads 483.3% — that is 483.3% over 25 years in total, not per year, and it is not directly comparable to a quoted annual return on a financial product.
Reading the payback against the horizon
If the payback period is shorter than the analysis period you entered, the array produces a net benefit inside the modelled life of the system, and the years after payback are what generate the surplus. If the payback lands beyond the horizon (or the tool cannot reach the net cost within \(Y\) years), the model shows no net benefit within the life you specified — the net benefit will be negative and the ROI below zero.
What the model deliberately leaves out
These are nominal cash figures under a single steady-escalation assumption. The calculation does not include:
- Finance costs — loan interest, fees or lease payments. Entering the cash price of a financed system understates the true outlay.
- Inflation adjustment / discounting — future savings are counted in future currency, so purchasing power is not held constant, and no discount rate is applied.
- Panel degradation — crystalline-silicon modules typically lose output slowly over time; manufacturer performance warranties commonly imply roughly 0.25–0.7% per year (about 0.5%/yr is a widely used planning figure). The model holds the annual saving constant in real terms instead.
- Inverter replacement — string inverters often have a shorter service life than the modules, so a 25-year horizon may contain one replacement cost.
- Maintenance, cleaning, monitoring and insurance, and any tariff-structure changes (time-of-use rates, fixed daily charges, export/feed-in tariff cuts) that would alter the effective saving.
Note also that rebate schemes, export tariffs and typical electricity-price escalation differ by country and by utility — the tool holds none of these as built-in defaults, so the realism of the result depends entirely on the local figures you enter. Currency is whatever currency you type in; the $ signs used in this article are only for readability.
This section explains how the numbers are produced; it is general information, not financial advice, and it makes no recommendation about whether to buy, finance or lease a system. For a decision involving borrowing or tax treatment, speak to a qualified professional.
How Payback Changes Across Scenarios
The baseline below is a $20,000 installed system with a $5,000 rebate (net cost $15,000), a $200 monthly electricity bill fully offset, 3% annual rate escalation and a 25-year analysis period. First-year savings are \(S = 12 \times B \times p\); every other column follows from the article's own formulas, so the rows reconcile with each other. Each row changes one driver only.
| Scenario | Net cost | First-year savings | Escalation g | Payback (years) | 25-year total savings | Net benefit | ROI |
|---|---|---|---|---|---|---|---|
| Escalation 0% (flat prices) | $15,000 | $2,400 | 0% | 6.25 | $60,000 | $45,000 | 300.0% |
| Baseline — escalation 3%, 100% offset | $15,000 | $2,400 | 3% | 5.81 | $87,502 | $72,502 | 483.3% |
| Escalation 6% | $15,000 | $2,400 | 6% | 5.46 | $131,675 | $116,675 | 777.8% |
| Offset 70% of the bill | $15,000 | $1,680 | 3% | 8.03 | $61,252 | $46,252 | 308.3% |
| Offset 50% of the bill | $15,000 | $1,200 | 3% | 10.77 | $43,751 | $28,751 | 191.7% |
| No rebate (full $20,000 paid) | $20,000 | $2,400 | 3% | 7.55 | $87,502 | $67,502 | 337.5% |
Baseline arithmetic, step by step
First-year saving:
$$S = 12 \times \$200 \times \frac{100}{100} = \$2{,}400 \qquad g = \frac{3}{100} = 0.03 \qquad C = \$20{,}000 - \$5{,}000 = \$15{,}000$$Cumulative savings after 5 full years (a geometric series):
$$\sum_{n=1}^{5} 2400\,(1.03)^{\,n-1} = 2400 \times \frac{(1.03)^{5} - 1}{0.03} = 2400 \times 5.30914 = \$12{,}741.93$$That is still short of $15,000, so the crossing happens in year 6 (\(k = 6\)), where the saving is \(2400 \times (1.03)^{5} = \$2{,}782.26\):
$$P_{\text{back}} = 5 + \frac{15{,}000 - 12{,}741.93}{2{,}782.26} = 5 + 0.81 = 5.81\ \text{years}$$Total savings over the 25-year horizon, then net benefit and ROI:
$$T = 2400 \times \frac{(1.03)^{25} - 1}{0.03} = 2400 \times 36.4593 = \$87{,}502$$$$T - C = 87{,}502 - 15{,}000 = \$72{,}502 \qquad \text{ROI} = \frac{72{,}502}{15{,}000} \times 100 = 483.3\%$$What the rows show
- Escalation is the biggest lever on lifetime totals, not on payback. Moving g from 0% to 6% shortens payback by only about 0.8 years (6.25 → 5.46) because early-year savings are barely escalated yet — but it more than doubles 25-year savings ($60,000 → $131,675), since the compounding all lands in the back half of the horizon.
- Offset drives payback almost proportionally. Halving the share of the bill solar replaces (100% → 50%) halves the annual saving and roughly doubles payback (5.81 → 10.77 years). This is the input most often set too optimistically: a system only offsets the consumption it actually serves, and unused midday generation is worth only whatever your export arrangement pays.
- A rebate improves payback and ROI but not lifetime savings. Removing the $5,000 incentive leaves total savings unchanged at $87,502 while pushing payback from 5.81 to 7.55 years and cutting ROI from 483.3% to 337.5% — incentive schemes act purely on the cost side, and they vary widely by country, state and utility.
All rows are undiscounted nominal cash and exclude finance costs, degradation, inverter replacement and maintenance, as described above.
Key Terms Explained
| Term | Symbol | Definition |
|---|---|---|
| System cost | \(C\) | The total installed price of the array — modules, inverter, mounting, wiring, labour, permits and any applicable sales tax — as quoted before incentives. Entered as System Cost. |
| Rebate / incentive | \(R\) | Any up-front reduction you actually receive: a grant, utility rebate, certificate value or tax credit. Enter it in the same currency units and only once (do not also subtract it from the system cost). |
| Net cost | \(C_{\text{net}}\) | The amount the savings must repay: \(C_{\text{net}} = C - R\). The calculator's formula box writes this net figure simply as \(C\). |
| Monthly bill | \(B\) | Your current average monthly electricity bill before solar. Use a 12-month average rather than a single month, since heating and cooling seasons distort any one bill. |
| Percent offset | \(p\) | The share of that bill the array actually replaces, as a percentage. Annual saving in year 1 is \(S = 12 \times B \times p/100\). Values below 100% reflect night-time and winter consumption still bought from the grid, and fixed supply charges that remain payable whatever you generate. |
| Annual rate escalation | \(g\) | The expected yearly rise in electricity prices, entered as a percentage and used as the decimal \(g = \text{Rate Increase}/100\). Year \(n\)'s saving is \(S\,(1+g)^{\,n-1}\). Historical escalation differs sharply between countries and utilities, so this should come from your own local tariff history, not a global figure. |
| Analysis period | \(N\) (field: years, \(Y\)) | The horizon over which savings are accumulated. 25 years is a common choice because many module manufacturers issue performance warranties of about 25–30 years; it is a modelling convention, not a guaranteed service life. |
| Payback period | \(P_{\text{back}}\) | Years until cumulative savings first equal \(C_{\text{net}}\), with linear interpolation within the crossing year. This is simple (undiscounted) payback — future savings are counted at face value, with no discount rate, no inflation adjustment and no finance cost, so it is not an IRR and not a discounted payback. |
| Lifetime (total) savings | \(T\) | \(T = \sum_{n=1}^{N} S\,(1+g)^{\,n-1}\) — all escalated annual savings added across the analysis period, in nominal currency. |
| Net benefit | \(T - C_{\text{net}}\) | Total savings less the net cost. Positive means the array repaid itself inside the horizon; negative means it did not. |
| ROI | \(\dfrac{T - C_{\text{net}}}{C_{\text{net}}} \times 100\) | A cumulative simple return over the whole analysis period, expressed as a percentage — not an annualised or compounded rate, and not adjusted for the timing of the cash flows. |
General information only; local tariffs, incentive rules and tax treatment vary by jurisdiction, so check the figures you enter against your own utility statement and national scheme documentation.
FAQ
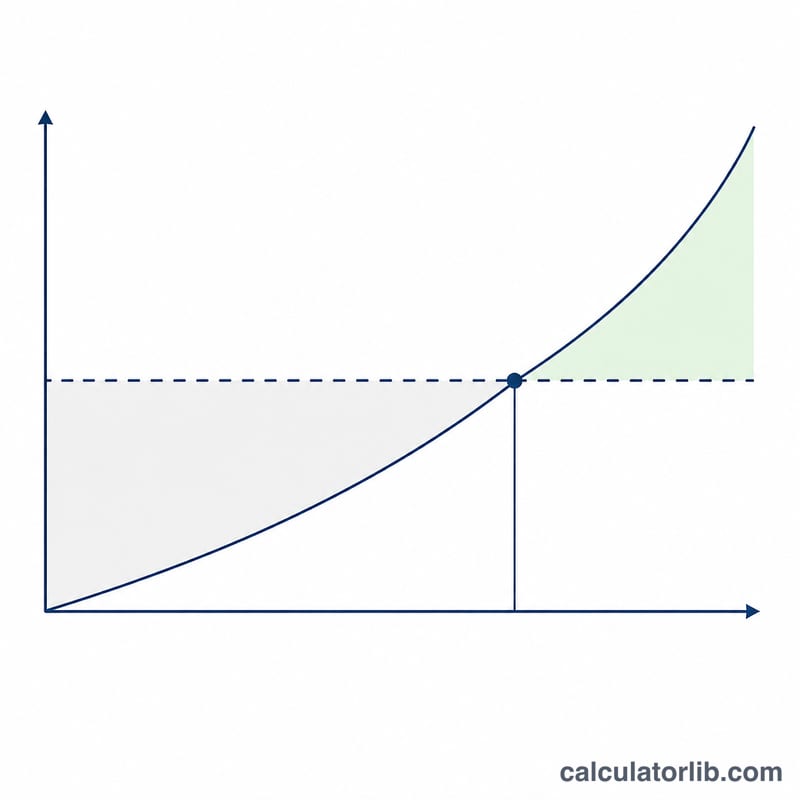
Why does a higher price-rise assumption shorten payback? Every unit of electricity you no longer buy is worth more each year, so annual savings compound and the cumulative line crosses the net cost sooner.
Does it include loan interest? No. It measures how fast the system repays its own net cost in cash savings. If you finance it, compare the payback period with your loan term — a payback shorter than the term means the panels cover the repayments.
What is not modelled? Panel degradation (roughly 0.5% per year), inverter replacement, maintenance and feed-in-tariff export credits. Treat the output as a planning estimate, not a quote.