What this calculator does
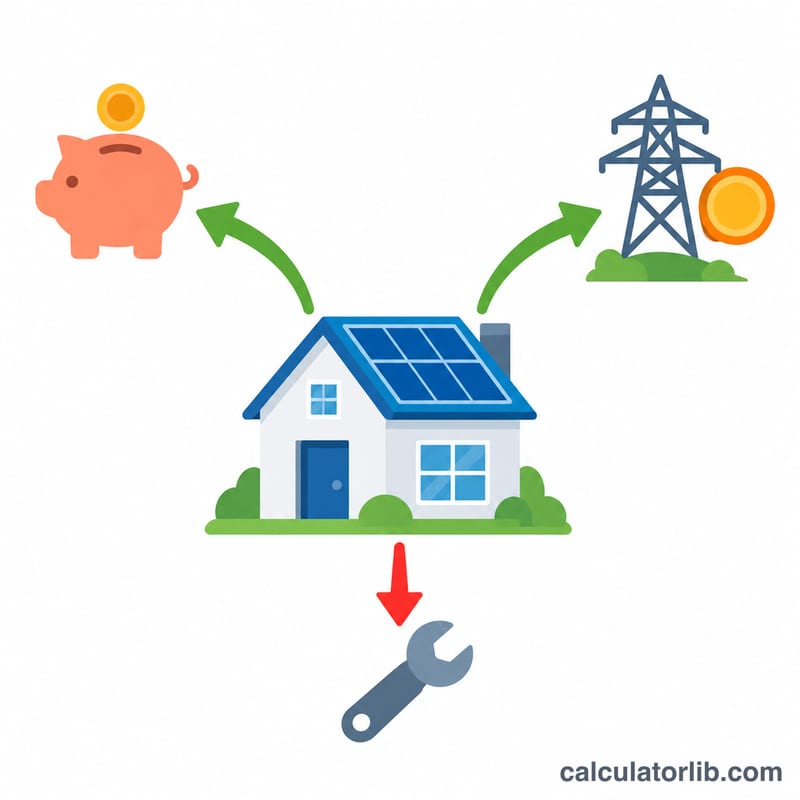
The UK Solar Panel Payback Calculator estimates how long it takes for a photovoltaic (PV) system to pay for itself. It compares your upfront installation cost against the money you save each year on electricity bills, plus any income from exporting surplus power under the Smart Export Guarantee (SEG), minus ongoing maintenance.
How to use it
Enter the total installation cost in pounds, your estimated annual saving on electricity bills, your annual export income, and any yearly maintenance cost. Set your expected system lifespan (UK panels typically last 25 years). The calculator returns your break-even point in years plus the projected lifetime savings and profit.
The formula explained
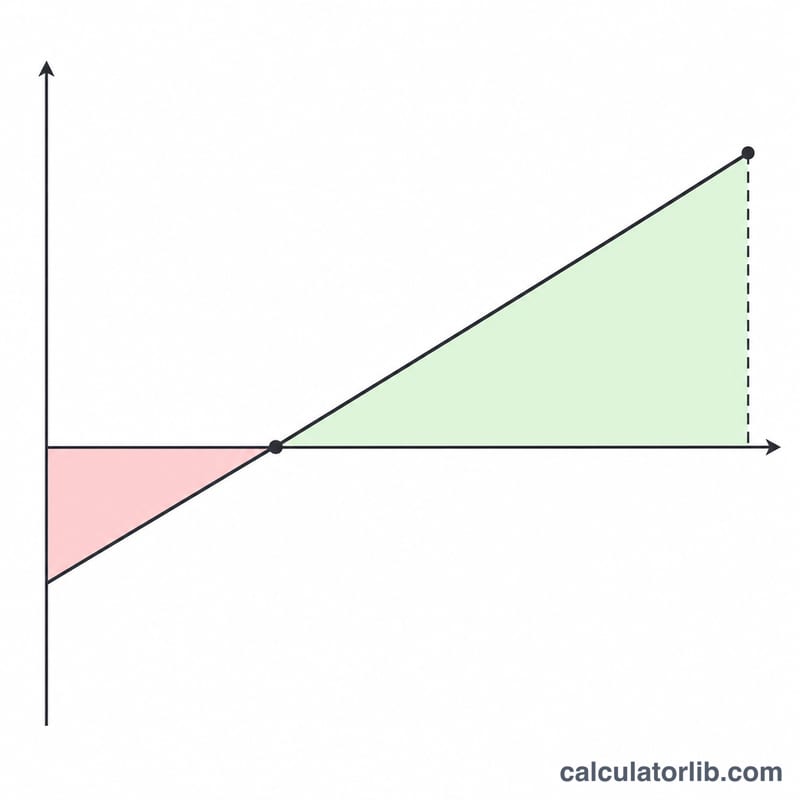
The payback period is the upfront cost divided by the net annual benefit:
$$\text{Payback (years)} = \frac{\text{Installation cost}}{\text{Savings} + \text{Export} - \text{Maintenance}}$$Here \(\text{Savings}\) is the yearly reduction in your electricity bill, \(\text{Export}\) is annual SEG income, and \(\text{Maintenance}\) is any recurring yearly cost such as inverter servicing.
Worked example
Suppose a system costs £7,000, saves £650 a year on bills, earns £150 from export, and costs £50 a year to maintain. The net annual benefit is:
$$\text{Net annual} = 650 + 150 - 50 = 750$$So the payback period is:
$$\text{Payback} = \frac{7000}{750} = 9.33\,\text{years}$$Over a 25-year lifespan the system returns \(750 \times 25 = 18{,}750\) in savings, a net profit of £11,750 after the initial cost.
Payback Across Typical UK System Scenarios
The table below runs four example UK home systems through the calculator's formula. Net annual benefit is \(N = \text{Bill Savings} + \text{Export Income} - \text{Maintenance}\). Payback is \(C \div N\), and the 25-year net profit is \(N \times 25 - C\). Export income assumes payments under the UK Smart Export Guarantee (SEG). All figures are illustrative round numbers, not quotes or market prices. Your installer's quote, your usage pattern and your SEG tariff will give different results.
| Scenario | Installation cost | Annual bill saving | Annual SEG export income | Annual maintenance | Net annual benefit | Payback (years) | 25-year net profit |
|---|---|---|---|---|---|---|---|
| 3 kWp, no battery | £5,500 | £380 | £120 | £20 | £480 | 11.5 | £6,500 |
| 4 kWp, no battery | £7,000 | £480 | £170 | £25 | £625 | 11.2 | £8,625 |
| 4 kWp with battery | £11,000 | £750 | £60 | £30 | £780 | 14.1 | £8,500 |
| 4 kWp, low self-use (out during the day) | £7,000 | £300 | £250 | £25 | £525 | 13.3 | £6,125 |
Here is the working for the 4 kWp system without a battery:
$$N = 480 + 170 - 25 = 625$$$$\text{Payback} = \frac{7000}{625} = 11.2 \text{ years}$$$$\text{Lifetime Profit} = 625 \times 25 - 7000 = 15625 - 7000 = 8625$$The battery raises bill savings because more of the generated power is used at home rather than exported. In this example, though, the extra cost outweighs the extra saving, so payback is longer. The low self-use household exports more but is usually paid less per kWh exported than it would save per kWh used, so its payback is also longer.
Interpreting Your Payback Result
Payback tells you how many years of net savings it takes to recover your upfront cost. To judge it, compare it with how long the system is likely to last:
- Panel lifespan: solar panels are commonly expected to last about 25 years, and many manufacturers' performance warranties run for about that long. That is why 25 years is a sensible default for the lifespan input.
- Inverter replacement: the inverter usually doesn't last as long as the panels. Many systems need one replacement during their life, often after 10–15 years. This cost isn't in the flat model unless you add it, for example by spreading it across the annual maintenance figure.
- Payback close to or beyond the lifespan: if the payback is near 25 years, or longer, the system will barely recover its cost before it wears out. That means little or no net return, and possibly a loss. A payback well inside the lifespan leaves more years of savings after break-even.
What the flat model leaves out
The calculator assumes the same net benefit every year. Real results will differ because of:
- Panel degradation: output typically falls by around 0.5% a year. After 25 years a panel may produce roughly 88% of its original output (\(0.995^{24} \approx 0.89\) in the final year). Savings and export income therefore shrink slowly over time.
- Electricity price changes: bill savings depend on the unit price you avoid paying. If prices rise, savings and payback improve. If they fall, both get worse. Prices in the UK have changed a lot in recent years, so no single figure holds for 25 years.
- SEG export rates: Smart Export Guarantee tariffs are a UK scheme. Each supplier sets its own rate, rates vary widely between suppliers, and they can change over time. Your export income is not fixed.
- Time value of money: £1 saved 20 years from now is worth less than £1 today, because the money spent upfront could have earned interest or been used elsewhere. Simple payback ignores this. A discounted analysis, such as net present value, gives a longer effective payback.
Payback is not return on investment
Two systems can have the same payback but very different returns. Payback only measures when you break even and ignores everything after that point. Lifetime profit, and measures such as annual return on the money invested, show how much you gain overall. Looking at both payback and lifetime profit gives a fuller picture than either alone.
This is general information, not financial advice. Get several installer quotes and check current tariffs before making a decision.
FAQ
Does this include energy price rises? No — it uses a flat annual saving. Rising electricity prices usually shorten the real payback time.
What is export income? Payments from your energy supplier for electricity you send back to the grid under the Smart Export Guarantee.
Is a shorter payback better? Yes. A shorter payback means you start making a net return on the investment sooner.