
What Is a Weekly Pay Calculator?
A weekly pay calculator turns either an annual salary or an hourly wage into the amount you earn in a single week. It is useful for budgeting, comparing job offers, planning savings, or simply understanding how your pay breaks down across different time periods. This tool is universal — it works with any currency, since it only performs arithmetic on the numbers you enter.
How to Use It
Choose your pay type. If you are salaried, select Annual Salary and enter your gross yearly pay. If you are paid by the hour, select Hourly Rate and enter your rate plus the number of hours you work each week. The calculator instantly shows your weekly pay along with daily, monthly and annual equivalents.
The Formula Explained
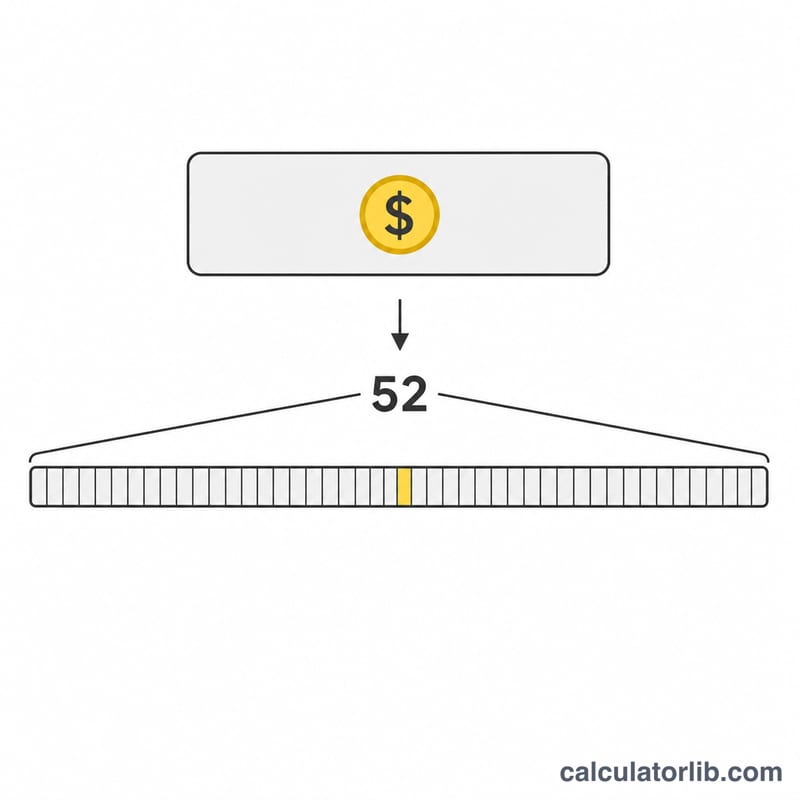
There are 52 weeks in a calendar year, so a salaried weekly figure is simply the annual salary divided by 52:
$$\text{Weekly Pay} = \frac{\text{Annual Salary}}{52}$$
For hourly workers, weekly pay is the rate multiplied by hours worked:
$$\text{Weekly Pay} = \text{Hourly Rate} \times \text{Hours per Week}$$
The monthly figure divides the annual amount by 12, and the daily figure assumes a standard 5-day working week.
Worked Example
Suppose your annual salary is 52,000. Dividing by 52 gives 1,000 per week. Over 12 months that is about 4,333.33 per month, and across a 5-day week roughly 200 per day. An hourly worker earning 20 per hour for 40 hours a week earns \(20 \times 40 = 800\) per week, or 41,600 per year.

Pay Period Conversion Table
Every pay period can be expressed as a weekly figure by multiplying or dividing by the number of periods in a year. This calculator uses the common convention of 52 weeks per year, so an annual salary is simply divided by 52:
$$\text{Weekly Pay} = \frac{\text{Annual Salary}}{52}$$The table below shows how to convert any gross pay period to a weekly equivalent. All figures are gross (before deductions) and currency-agnostic — the arithmetic is identical whatever currency you are paid in.
| Pay period | Periods per year | Convert to weekly | Example (annual 52,000) |
|---|---|---|---|
| Hourly | — | × hours worked per week | 25.00/h × 40 h = 1,000.00 |
| Daily | ≈ 260 working days | × days worked per week (usually 5) | 200.00 × 5 = 1,000.00 |
| Weekly | 52 | × 1 (no conversion) | 1,000.00 |
| Bi-weekly (every 2 weeks) | 26 | ÷ 2 | 2,000.00 ÷ 2 = 1,000.00 |
| Semi-monthly (twice a month) | 24 | × 24 ÷ 52 (≈ × 0.4615) | 2,166.67 × 24 ÷ 52 = 1,000.00 |
| Monthly | 12 | × 12 ÷ 52 (≈ × 0.2308) | 4,333.33 × 12 ÷ 52 = 1,000.00 |
| Quarterly | 4 | × 4 ÷ 52 (= ÷ 13) | 13,000.00 ÷ 13 = 1,000.00 |
| Annual | 1 | ÷ 52 | 52,000.00 ÷ 52 = 1,000.00 |
Standard hours and the 52-week convention
A 40-hour week over 52 weeks gives the widely used full-time figure of 2,080 hours per year:
$$40 \ \text{h/week} \times 52 \ \text{weeks} = 2{,}080 \ \text{h/year}$$The 2,080-hour benchmark and the 40-hour standard week are conventions in the United States and Canada; contractual full-time hours elsewhere are often 35–39 per week, so check your own contract or national rules before using 2,080.
A calendar year is not exactly 52 weeks. It contains \(365 \div 7 = 52.143\) weeks (\(366 \div 7 = 52.286\) in a leap year). Because of this:
- Some years contain 53 weekly pay dates rather than 52, and 27 bi-weekly pay dates rather than 26, depending on which weekday your employer pays and when the year starts.
- Bi-weekly pay (26 cheques) and semi-monthly pay (24 cheques) are not the same thing: 26 × bi-weekly = 24 × semi-monthly = the annual salary, but the individual cheques differ in size. Bi-weekly and semi-monthly cycles are common in the United States and Canada; monthly pay is the norm in much of Europe and Asia.
- Using 52.143 instead of 52 lowers a weekly figure by about 0.27% — on 52,000 per year that is 1,000.00 versus 997.26.
Weekly Pay Across Common Scenarios
The scenarios below show gross pay only, before income tax, pension or social-security contributions. Salary inputs are divided by 52 for the weekly figure and by 12 for the monthly figure; hourly inputs are multiplied by the hours entered, then annualised over 52 weeks. Values are currency-agnostic — read them as dollars, euros, pounds or any other unit.
| Input type | Input value | Hours / week | Weekly (gross) | Monthly (gross) | Annual (gross) |
|---|---|---|---|---|---|
| Annual salary | 30,000 / yr | n/a (salaried) | 576.92 | 2,500.00 | 30,000.00 |
| Annual salary | 52,000 / yr | n/a (salaried) | 1,000.00 | 4,333.33 | 52,000.00 |
| Annual salary | 75,000 / yr | n/a (salaried) | 1,442.31 | 6,250.00 | 75,000.00 |
| Hourly (part-time) | 15.00 / h | 20 | 300.00 | 1,300.00 | 15,600.00 |
| Hourly (full-time) | 20.00 / h | 40 | 800.00 | 3,466.67 | 41,600.00 |
| Hourly + overtime | 35.00 / h | 45 (40 + 5 OT) | 1,662.50 | 7,204.17 | 86,450.00 |
How each row is calculated
75,000 salary: the annual amount is spread evenly over 52 weeks and 12 months.
$$\frac{75{,}000}{52} = 1{,}442.31 \ \text{per week}, \qquad \frac{75{,}000}{12} = 6{,}250.00 \ \text{per month}$$20.00 per hour × 40 hours: weekly pay is rate × hours, and the annual and monthly figures follow from it.
$$20.00 \times 40 = 800.00 \ \text{per week} \;\Rightarrow\; 800.00 \times 52 = 41{,}600.00 \ \text{per year} \;\Rightarrow\; \frac{41{,}600.00}{12} = 3{,}466.67 \ \text{per month}$$35.00 per hour × 45 hours with overtime shown separately: the first 40 hours are paid at the base rate and the extra 5 hours at 1.5 × the base rate.
$$\text{Regular} = 35.00 \times 40 = 1{,}400.00$$$$\text{Overtime} = (35.00 \times 1.5) \times 5 = 52.50 \times 5 = 262.50$$$$\text{Total weekly} = 1{,}400.00 + 262.50 = 1{,}662.50 \;\Rightarrow\; \times 52 = 86{,}450.00 \ \text{per year}$$Note that the calculator multiplies the rate by the hours you enter at a single rate: entering 35.00 and 45 hours returns 1,575.00 straight-time pay, not 1,662.50. To include a premium, enter the overtime hours separately or enter a blended rate. The 1.5 × premium after 40 hours in a week is the rule for non-exempt employees under the US Fair Labor Standards Act; overtime thresholds and multipliers differ by country, state and collective agreement, so use the premium that applies to your own contract.
Interpreting Your Weekly Pay Result
The figure is gross, not take-home
Everything this calculator returns — weekly, daily, monthly and annual — is gross pay before deductions. Income tax, social-security or payroll contributions, pension or retirement contributions, health insurance, student-loan repayments, union dues and salary-sacrifice arrangements are all subtracted afterwards. The gap between gross and net varies widely by country, by region within a country, and by individual circumstances, so your actual bank deposit will be smaller than the number shown, often substantially. Use a payslip or a country-specific net-pay tool if you need the after-tax amount.
Why 52 is a convention, not an exact year
Dividing by 52 is the standard convenience convention, but a year contains \(365 \div 7 = 52.143\) weeks. Small discrepancies follow:
- Multiplying the weekly result back by 52 returns your salary exactly; multiplying by 52.143 returns slightly more.
- Depending on the payday weekday and the calendar, a year can contain 53 weekly pay dates or 27 bi-weekly pay dates instead of the usual 52 or 26. Employers handle this differently — some pay an extra cheque, others recalculate each period — so an annualised weekly figure may not match your payslips in such a year.
- Semi-monthly pay (24 cheques) never aligns with weeks at all: each cheque covers roughly 2.17 weeks, so a semi-monthly amount divided by 2 is not the weekly rate.
For a simple sanity check on any salary: weekly pay ≈ monthly pay × 12 ÷ 52, and annual pay ≈ weekly pay × 52.
What the daily figure assumes
The daily equivalent divides the weekly amount by a 5-day working week:
$$\text{Daily} = \frac{\text{Weekly Pay}}{5} = \frac{\text{Annual Salary}}{260}$$If you work a 4-day, 6-day or rotating shift pattern, divide the weekly figure by your own number of working days instead. The daily figure is a pro-rata average, not a contractual day rate, and it does not account for public holidays, paid or unpaid leave, or the fact that a salaried year contains roughly 260 working days before holidays are removed.
What is excluded
- Variable pay: bonuses, commission, tips, shift differentials, profit share and one-off payments are not included unless you build them into the input yourself.
- Overtime premiums: the hourly mode multiplies one rate by the hours you enter, so any 1.5 × or 2 × premium must be entered as separate hours or as a blended rate.
- Unpaid time: unpaid leave, strike days, furlough or weeks with no shifts reduce actual pay below the calculated average.
- Employer costs: employer-side pension or payroll contributions and benefits in kind are not part of gross pay and are not shown.
Hourly results reflect only the hours you enter
In hourly mode the weekly result is exactly rate × hours. If your hours fluctuate week to week, the output describes only a week with those hours — not a reliable average income. For irregular or zero-hours work, run the calculation with a low-hours week and a high-hours week to see the realistic range, or enter your average hours over the past 8–13 weeks rather than a single good week. Annualising a single busy week overstates yearly earnings.
This page provides general information about pay arithmetic only. It is not tax, payroll, employment or financial advice, and it does not reflect the rules of any particular country. For advice on your own pay, contract or deductions, consult your employer's payroll department or a qualified professional.
Income and jobs: United States
Average income and unemployment in United States compared with the world, from the World Bank: a benchmark for the figures you enter above.
- GNI per capita 2025
- 88,810 USD
- GDP per capita, PPP 2025
- 90,027 intl. $
- World: 25,704
- Unemployment 2025
- 4.2%
- World: 4.8%
Latest change Up +7.1% 2025: 88,810 USD, against 82,910 USD in 2024. CalculatorLib computes this change from the two published figures.
In 2025, gross national income per person in United States was 88,810 US dollars a year, about 7,401 US dollars a month. World: 14,244 USD
| Year | GNI per capita (USD) | GDP per capita, PPP (intl. $) | Unemployment |
|---|---|---|---|
| 2025 | 88,810 | 90,027 | 4.2% |
| 2024 | 82,910 | 86,170 | 4.0% |
| 2023 | 79,950 | 82,587 | 3.6% |
| 2022 | 77,230 | 78,009 | 3.7% |
| 2021 | 71,510 | 71,441 | 5.3% |
| 2020 | 64,630 | 64,465 | 8.1% |
| 2019 | 65,840 | 65,228 | 3.7% |
| 2018 | 63,040 | 62,876 | 3.9% |
| 2017 | 58,860 | 60,048 | 4.4% |
| 2016 | 56,830 | 57,977 | 4.9% |
GNI per capita (Atlas method) is the average of all income in the economy, not a typical salary; PPP dollars adjust for local prices.
Income tax and social security: United States
- Top income tax rate 2025
- 43.65%
- from 8.7 × the average wage
- Employee social security 2025
- 7.65% · 1.45%
In 2025, the top statutory personal income tax rate in United States (central and local government combined) was 43.65%. It applies from 8.7 times the average wage of 73,520 USD, that is from about 642,101 USD a year.
Employee social security contribution rates for successive earnings bands, lowest band first; the band limits are not shown.
Top income tax rates in OECD countries
| Country | Top rate | Applies from (× average wage) | Year |
|---|---|---|---|
| Japan | 55.95% | 7.7 | 2025 |
| France | 55.37% | 12.9 | 2025 |
| South Korea | 49.5% | 19.0 | 2025 |
| Germany | 47.48% | 4.4 | 2025 |
| United Kingdom | 45% | 2.2 | 2025 |
| United States | 43.65% | 8.7 | 2025 |
| Türkiye | 40.76% | 5.6 | 2025 |
| Mexico | 35% | 20.6 | 2025 |
The top rate is the statutory rate on the highest earnings, not the rate most workers pay. OECD figures cover OECD member countries only.
United States and other countries
GNI per capita in current US dollars (Atlas method) — each country’s latest published year.
- United States 88,810 USD (2025)
- France 48,630 USD (2025)
- Japan 38,340 USD (2025)
- South Korea 37,880 USD (2025)
- Saudi Arabia 36,070 USD (2025)
- Türkiye 16,300 USD (2025)
- Russia 15,960 USD (2025)
- World 14,244 USD (2025)
- China 14,230 USD (2025)
- Mexico 13,730 USD (2025)
- Vietnam 4,970 USD (2025)
- India 2,760 USD (2025)
No published figure yet for Taiwan.
Years can differ between rows: each figure is shown with its own year. The same World Bank indicator for every country.
Latest figure: 2025 Data last updated 2026-10-18 · current
Source: The World Bank Group CC BY 4.0; OECD, Tax Database CC BY 4.0
Monthly figures are computed by CalculatorLib from these data. The top-rate threshold in national currency (multiple × average wage) is computed by CalculatorLib from these data.
Source details and methodology
- The World Bank Group — World Development Indicators (NY.GNP.PCAP.CD, NY.GDP.PCAP.PP.CD, SL.UEM.TOTL.ZS)
- OECD, Tax Database — Top statutory personal income tax rate; employee social security contribution rates
FAQ
Does this account for tax? No. The result is gross (before tax) pay. Deductions vary by location and personal circumstances.
Why divide by 52 and not 52.14? A year has about 52.14 weeks, but 52 is the standard convention used by most payroll systems. We use 52 for consistency.
Can I use any currency? Yes. The math is currency-agnostic, so enter values in whatever currency you are paid in.