What is a Win Percentage?
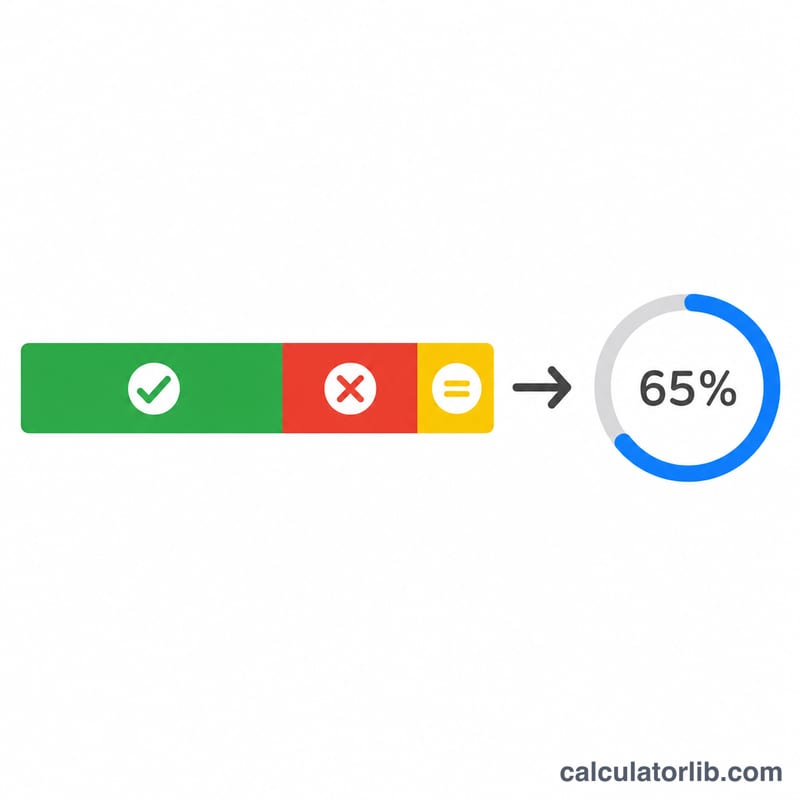
Win percentage measures the share of games a team or player has won out of all games played. It is the standard way to rank teams across most sports leagues. When ties (draws) are possible, each tie is conventionally counted as half a win, so a tie raises your percentage by less than a win but more than a loss.
How to Use This Calculator
Enter the number of wins, losses, and ties from the record you want to evaluate. Leave ties at 0 for sports without draws (like basketball or baseball). The calculator instantly returns the win percentage along with the total number of games played.
The Formula Explained
The win percentage is calculated as:
$$\text{Win \%} = \frac{\text{Wins} + 0.5 \times \text{Ties}}{\text{Wins} + \text{Losses} + \text{Ties}} \times 100$$
Counting ties as half a win reflects the idea that a draw is exactly halfway between a win and a loss. The denominator is the total games played, so the result always falls between 0% and 100%.
Worked Example
Suppose a soccer team has 12 wins, 6 losses, and 4 ties. Total games = \(12 + 6 + 4 = 22\). The numerator is \(12 + 0.5 \times 4 = 14\). So $$\text{Win \%} = \frac{14}{22} \times 100 = 63.64\%.$$
Interpreting Your Win Percentage
Win percentage answers one question: what share of your games did you win, counting a tie as half a win? The formula is
$$\text{Win \%} = \frac{\text{Wins} + 0.5 \times \text{Ties}}{\text{Wins} + \text{Losses} + \text{Ties}} \times 100$$Because a tie is worth half a win, a team that ties every game lands exactly at 50% — the same place as a team that splits its wins and losses evenly.
The three bands
- Above .500 (over 50%) — a winning record: more wins than losses.
- Exactly .500 (50%) — break-even: wins and losses (with ties counted as half) cancel out. A 9-9 record and an 8-8-2 record are both .500.
- Below .500 (under 50%) — a losing record: more losses than wins.
"Playing .500 ball" is simply league shorthand for breaking even, and "games over .500" counts the surplus: a 55-45 team is 10 games over .500.
Why standings print .636 instead of 63.6%
North American leagues express the same number as a decimal proportion rather than a percentage. A 7-4 team has \( 7 \div 11 = 0.6363\ldots \), printed in the standings as .636 and read aloud as "six thirty-six." It is the identical quantity as 63.6% — only the ×100 step is dropped. Major League Baseball and the NBA quote winning percentage to three decimal places, as does the NFL (where ties count as half a win, so a 7-8-1 record is .469). Rounding at three decimals is enough to separate almost every pair of teams, but exact ties in percentage do occur and are broken by league-specific tiebreakers.
What gets derived from this number
Win percentage is the backbone of a standings table. Playoff seeding within a division or conference is ordered by it, and games behind (GB) is computed directly from the win-loss columns of the leader and the chasing team:
$$\text{GB} = \frac{(W_{\text{leader}} - W_{\text{team}}) + (L_{\text{team}} - L_{\text{leader}})}{2}$$Because percentage — not raw wins — drives the ordering, a team that has played fewer games can sit higher in the table while trailing in total victories.
Worked example
A team finishes 60-30 with no ties. Substituting:
$$\text{Win \%} = \frac{60 + 0.5 \times 0}{60 + 30 + 0} \times 100 = \frac{60}{90} \times 100 = 66.67\%$$That is a win percentage of 66.67%, shown in a baseball-style standings table as .667.
Add ties and the denominator still counts every game. A 7-8-1 season gives
$$\text{Win \%} = \frac{7 + 0.5 \times 1}{7 + 8 + 1} \times 100 = \frac{7.5}{16} \times 100 = 46.88\%$$or 46.88% — a losing record, printed as .469.
What the percentage does not tell you
Two limits matter whenever you compare records:
- Sample size. A 3-0 start is 100%, but three games carry very little information; a single loss drops it to 75%. A 60-30 record is 66.7% over 90 games and is far harder to achieve by luck. Short records swing wildly and should be treated as provisional.
- Strength of schedule. The formula treats every opponent as identical. A .600 record against the strongest half of a league is a very different achievement from .600 against the weakest, which is why analysts pair win percentage with schedule-adjusted ratings, point differential or head-to-head results rather than relying on it alone.
Win percentage is also blind to margin — a one-point win and a blowout both count as exactly one win.
Key Terms and Variables
| Term | Meaning |
|---|---|
| Win (W) | A completed contest decided in your favor. Counts as 1 full unit in the numerator and 1 game in the denominator. |
| Loss (L) | A completed contest decided against you. Contributes 0 to the numerator but still counts as 1 game played. |
| Tie / Draw (T) | A contest that ends level. Counted as half a win (0.5) in the numerator and a full game in the denominator — the standard convention in NFL and college-football-style records. Some competitions eliminate ties entirely with overtime or a shootout. |
| Total games played (GP) | The denominator: \( GP = W + L + T \). Every counted contest appears here exactly once. |
| Win percentage | \( (W + 0.5T) \div GP \), expressed either as a percentage (63.6%) or as a three-decimal proportion (.636). Always between 0 and 1 (0% and 100%). |
| Winning record / .500 | .500 is the break-even point (equal wins and losses). Above .500 is a winning record, below .500 a losing one. "Games over .500" = \( (W - L) \div 2 \) expressed in games, or simply \( W - L \) when quoted as "games above" in the looser sense — check which convention a source uses. |
| Games behind (GB) | How far a team trails the leader, averaging the win gap and the loss gap: \( GB = \big[(W_{\text{lead}} - W) + (L - L_{\text{lead}})\big] \div 2 \). Half-game values appear when the two teams have played a different number of games. |
| Point percentage | A different metric used where standings are decided by points rather than wins. In association football's common 3-1-0 system (3 points for a win, 1 for a draw), point percentage = \( \text{points} \div (3 \times GP) \). In the NHL's system (2 points for a win, 1 for an overtime or shootout loss, 0 for a regulation loss), "points percentage" = \( \text{points} \div (2 \times GP) \). These do not equal win percentage: a draw is worth one-third of a win in the 3-1-0 system, not one-half, and an NHL overtime loss earns a point while still recording as a loss. |
| No-contest / no-decision | A scheduled event that produced no result — a cancelled or abandoned game, a forfeit handled outside the standings, a bout ruled a no-contest, or a pitcher's start with no decision. These are normally excluded from both the numerator and the denominator, so they neither help nor hurt the percentage. Competition rules differ on forfeits, which some leagues record as a loss for one side; check the specific league's regulations before entering them. |
When entering your record, use only completed, counted contests: wins, losses and ties. If your competition awards points rather than treating draws as half-wins, the win percentage here still describes your win-loss record accurately, but it will not reproduce your position in a points table.
FAQ
Do ties count as half a win? Yes — that is the standard convention used by most leagues, where a tie is worth 0.5 in the win column for ranking purposes.
What if I have no ties? Set ties to 0 and the formula simplifies to \(\text{Wins} \div (\text{Wins} + \text{Losses}) \times 100\).
Is win percentage the same as winning record? A winning record means more wins than losses, i.e. a win percentage above 50%. Exactly 50% is a break-even record.