
What Is the Salary After Tax Calculator?
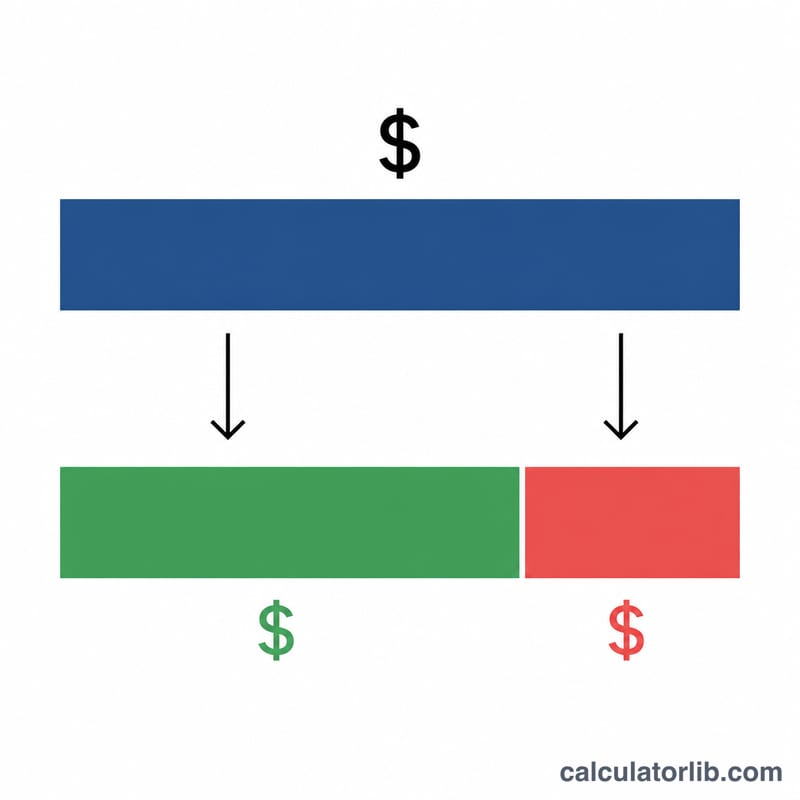
This calculator estimates your net annual salary — the money you actually keep — by subtracting tax from your gross pay. It uses a single effective tax rate, which is the average percentage of your income that goes to tax once everything is combined. It works for any currency or country since you supply the rate yourself, making it a flexible, universal take-home estimator rather than a jurisdiction-specific tax tool.
How to Use It
Enter your gross annual salary (your total pay before any deductions) and your effective tax rate as a percentage. The calculator returns your net annual salary, the total tax amount, and your net monthly take-home pay. If you are unsure of your effective rate, divide last year's total tax by your total income and multiply by 100.
The Formula Explained
The core equation is:
$$\text{Net} = \text{Gross} - \left(\text{Gross} \times \frac{\text{Rate}}{100}\right)$$
This can be simplified to \(\text{Net} = \text{Gross} \times \left(1 - \frac{\text{Rate}}{100}\right)\). The total tax is \(\text{Gross} \times \frac{\text{Rate}}{100}\), and the monthly take-home is the net annual figure divided by 12.
Worked Example
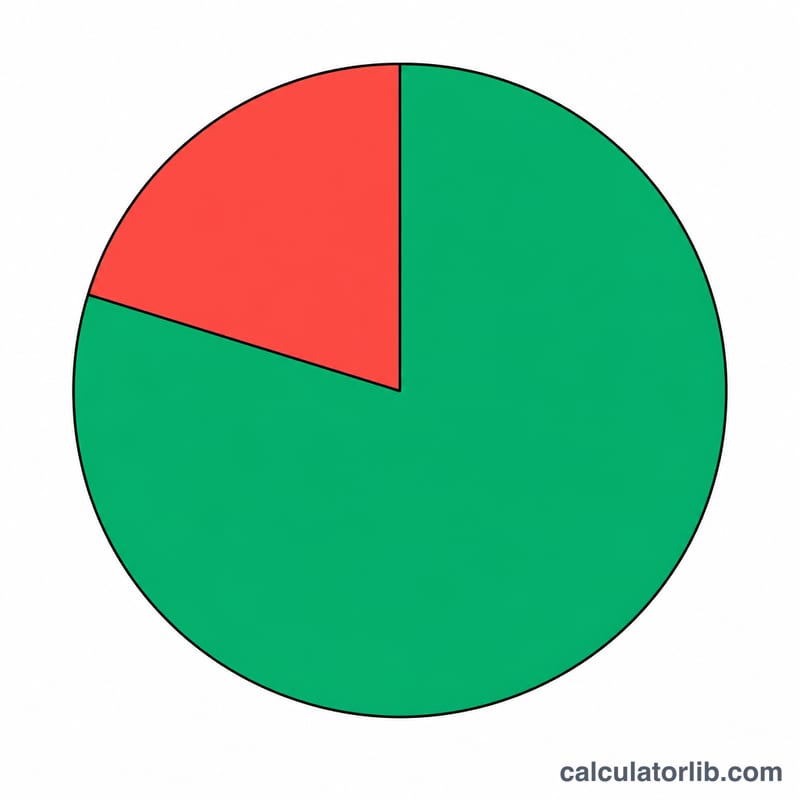
Suppose your gross annual salary is 60,000 and your effective tax rate is 25%. The tax is $$60{,}000 \times 0.25 = 15{,}000.$$ Your net annual salary is $$60{,}000 - 15{,}000 = 45{,}000,$$ and your monthly take-home is $$45{,}000 \div 12 = 3{,}750.$$
Net Salary Across Different Tax Rates
The table below holds a gross salary fixed at \(\$60{,}000\) and varies the effective tax rate. For each rate, the annual tax is \(\text{Gross}\times\frac{\text{Rate}}{100}\), the net annual is \(\text{Gross}\times\left(1-\frac{\text{Rate}}{100}\right)\), and the net monthly is the net annual divided by 12.
| Effective Rate | Annual Tax | Net Annual | Net Monthly |
|---|---|---|---|
| 10% | $6,000 | $54,000 | $4,500 |
| 20% | $12,000 | $48,000 | $4,000 |
| 25% | $15,000 | $45,000 | $3,750 |
| 30% | $18,000 | $42,000 | $3,500 |
| 40% | $24,000 | $36,000 | $3,000 |
Notice that each 10-percentage-point increase in the effective rate reduces net annual pay by \(\$6{,}000\) (10% of \(\$60{,}000\)) and net monthly pay by \(\$500\). The relationship is strictly linear because a single flat effective rate is applied to the whole salary.
Interpreting Your Net Salary Result
The net figure this calculator returns is your true take-home pay only if the rate you entered captures every deduction taken from your paycheck. In many countries that means income tax plus social-security or payroll contributions (for example FICA in the US, National Insurance in the UK, or CPP/EI in Canada). If your entered rate reflects income tax alone, the real amount reaching your bank account will be lower than the result shown.
Be careful to use your effective (average) rate, not your marginal rate. The marginal rate is the tax on your last dollar earned and sits at the top bracket you reach; the effective rate is total tax divided by total income and is always lower under a progressive system. Entering a marginal rate here would overstate the tax and understate your take-home pay. If you only know your total tax, divide it by your gross to get the effective rate before using this tool.
The monthly figure assumes an even, equal spread across all twelve months \(\left(\text{Net Monthly}=\frac{\text{Net Annual}}{12}\right)\). Real paychecks rarely match this exactly: bonuses, commissions, variable hours, mid-year raises, and changes in withholding can all shift money between periods. Treat the monthly number as a planning average rather than the precise amount of any single payslip.
Finally, this model does not separately account for pre-tax pension contributions or benefits such as 401(k)/RRSP deferrals, health-insurance premiums, or salary-sacrifice arrangements. Those reduce your taxable base and your cash take-home in ways a single flat rate cannot represent. If you contribute to such plans, the result here approximates only the tax-versus-net split and not your final spendable cash. For a more granular breakdown, recompute your effective rate to include all withholdings, or use a jurisdiction-specific income-tax calculator.
This is general information for estimation purposes, not professional tax advice. Consult a qualified tax professional for guidance on your specific situation.
Income and jobs: United States
Average income and unemployment in United States compared with the world, from the World Bank: a benchmark for the figures you enter above.
- GNI per capita 2025
- 88,810 USD
- GDP per capita, PPP 2025
- 90,027 intl. $
- World: 25,704
- Unemployment 2025
- 4.2%
- World: 4.8%
Latest change Up +7.1% 2025: 88,810 USD, against 82,910 USD in 2024. CalculatorLib computes this change from the two published figures.
In 2025, gross national income per person in United States was 88,810 US dollars a year, about 7,401 US dollars a month. World: 14,244 USD
| Year | GNI per capita (USD) | GDP per capita, PPP (intl. $) | Unemployment |
|---|---|---|---|
| 2025 | 88,810 | 90,027 | 4.2% |
| 2024 | 82,910 | 86,170 | 4.0% |
| 2023 | 79,950 | 82,587 | 3.6% |
| 2022 | 77,230 | 78,009 | 3.7% |
| 2021 | 71,510 | 71,441 | 5.3% |
| 2020 | 64,630 | 64,465 | 8.1% |
| 2019 | 65,840 | 65,228 | 3.7% |
| 2018 | 63,040 | 62,876 | 3.9% |
| 2017 | 58,860 | 60,048 | 4.4% |
| 2016 | 56,830 | 57,977 | 4.9% |
GNI per capita (Atlas method) is the average of all income in the economy, not a typical salary; PPP dollars adjust for local prices.
Income tax and social security: United States
- Top income tax rate 2025
- 43.65%
- from 8.7 × the average wage
- Employee social security 2025
- 7.65% · 1.45%
In 2025, the top statutory personal income tax rate in United States (central and local government combined) was 43.65%. It applies from 8.7 times the average wage of 73,520 USD, that is from about 642,101 USD a year.
Employee social security contribution rates for successive earnings bands, lowest band first; the band limits are not shown.
Top income tax rates in OECD countries
| Country | Top rate | Applies from (× average wage) | Year |
|---|---|---|---|
| Japan | 55.95% | 7.7 | 2025 |
| France | 55.37% | 12.9 | 2025 |
| South Korea | 49.5% | 19.0 | 2025 |
| Germany | 47.48% | 4.4 | 2025 |
| United Kingdom | 45% | 2.2 | 2025 |
| United States | 43.65% | 8.7 | 2025 |
| Türkiye | 40.76% | 5.6 | 2025 |
| Mexico | 35% | 20.6 | 2025 |
The top rate is the statutory rate on the highest earnings, not the rate most workers pay. OECD figures cover OECD member countries only.
United States and other countries
GNI per capita in current US dollars (Atlas method) — each country’s latest published year.
- United States 88,810 USD (2025)
- France 48,630 USD (2025)
- Japan 38,340 USD (2025)
- South Korea 37,880 USD (2025)
- Saudi Arabia 36,070 USD (2025)
- Türkiye 16,300 USD (2025)
- Russia 15,960 USD (2025)
- World 14,244 USD (2025)
- China 14,230 USD (2025)
- Mexico 13,730 USD (2025)
- Vietnam 4,970 USD (2025)
- India 2,760 USD (2025)
No published figure yet for Taiwan.
Years can differ between rows: each figure is shown with its own year. The same World Bank indicator for every country.
Latest figure: 2025 Data last updated 2026-10-18 · current
Source: The World Bank Group CC BY 4.0; OECD, Tax Database CC BY 4.0
Monthly figures are computed by CalculatorLib from these data. The top-rate threshold in national currency (multiple × average wage) is computed by CalculatorLib from these data.
Source details and methodology
- The World Bank Group — World Development Indicators (NY.GNP.PCAP.CD, NY.GDP.PCAP.PP.CD, SL.UEM.TOTL.ZS)
- OECD, Tax Database — Top statutory personal income tax rate; employee social security contribution rates
FAQ
What is an effective tax rate? It is the average rate you pay across all your income, not the top marginal bracket. For most people it is lower than their highest bracket because of allowances and lower bands.
Does this include social security or pension? Only if you fold those into your effective rate. The tool subtracts whatever single combined percentage you enter.
Can I use it for any country? Yes — because you provide the rate, it works in any currency and jurisdiction. For precise official figures, use your country's tax authority calculator.