What this calculator does
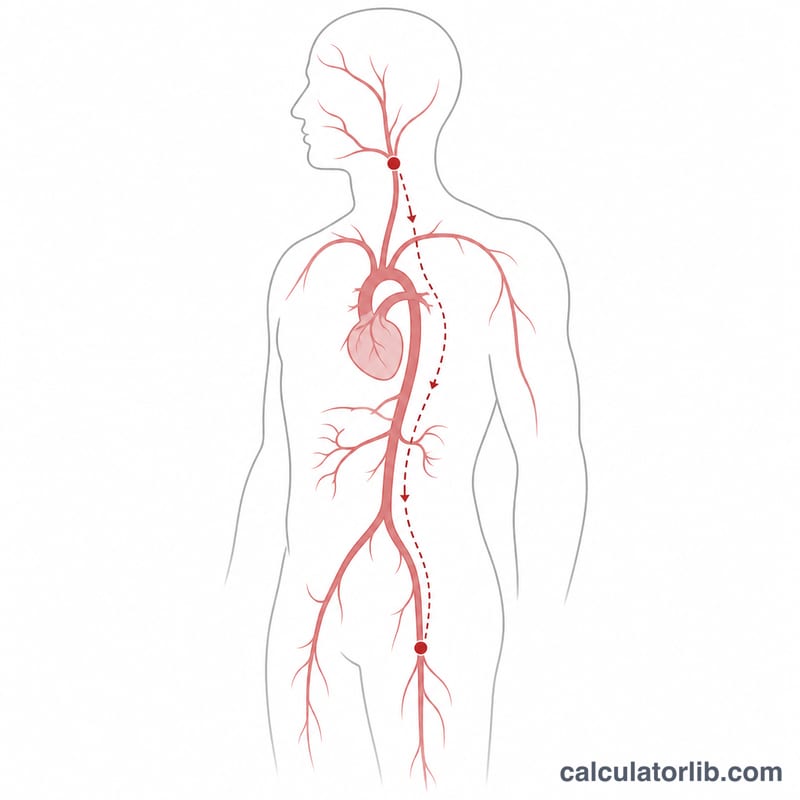
The Arterial (Vascular) Age Calculator estimates the "age" of your arteries from a single measurement: carotid-femoral pulse wave velocity (PWV), the speed at which the pressure wave from each heartbeat travels along your aorta. Stiffer arteries carry the wave faster, so a higher PWV usually means older, less elastic vessels. This is an educational tool, not a medical diagnosis, and it works with any population intercept and slope you choose.
The inputs explained
- Pulse Wave Velocity (m/s) — your measured carotid-femoral PWV, typically from a device like SphygmoCor or Complior.
- Chronological Age (years) — your actual age, used only to compute the gap against your estimated vascular age.
- Intercept (m/s) — the PWV expected at age zero in a reference equation (default 4.0).
- Slope (m/s per year) — how much PWV rises per year of age in that reference equation (default 0.07). If you leave it at zero, the tool falls back to 0.07.
The formula
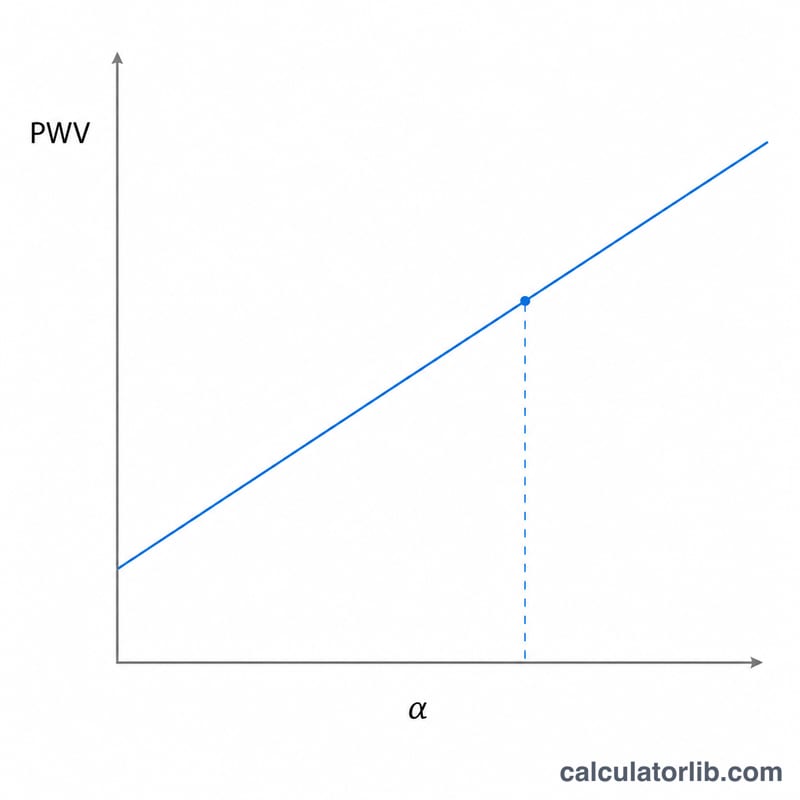
The calculator reverses a simple linear PWV-versus-age relationship (\(\text{PWV} = m \times \text{age} + b\)) to solve for age:
$$\text{Vascular Age} = \frac{\text{PWV} - \text{intercept}}{\text{slope}}$$
It then reports an age gap:
$$\text{age gap} = \text{vascular age} - \text{chronological age}$$A positive gap suggests your arteries are "older" than your years; a negative gap suggests they are "younger."
Worked example
Suppose you are 45 years old with a measured PWV of 8.5 m/s, using the default intercept of 4.0 and slope of 0.07:
- $$\text{Vascular Age} = \frac{8.5 - 4.0}{0.07} = \frac{4.5}{0.07} \approx 64 \text{ years}$$
- $$\text{Age gap} = 64 - 45 = +19 \text{ years}$$
In this example the arteries behave like those of a typical 64-year-old — a signal worth discussing with a clinician about cardiovascular risk.
Reference PWV Values by Age
Carotid-femoral pulse wave velocity (cfPWV) is the accepted non-invasive gold-standard measure of aortic stiffness. It rises with age as the elastic fibers of the aorta fatigue and stiffen. The values below are summarized from the large pooled analysis of European reference values for arterial stiffness (Mattace-Raso et al., European Heart Journal, 2010), expressed as approximate mean (and roughly the 10th–90th percentile range) by age decade for subjects with normal blood pressure (≤120/80 mmHg). PWV is measured in meters per second (m/s).
| Age group (years) | Mean cfPWV (m/s) | Approx. reference range (m/s) |
|---|---|---|
| <30 | 6.2 | 4.7 – 7.6 |
| 30–39 | 6.5 | 3.8 – 9.2 |
| 40–49 | 7.2 | 4.6 – 9.8 |
| 50–59 | 8.3 | 4.5 – 12.1 |
| 60–69 | 10.3 | 5.5 – 15.0 |
| ≥70 | 10.9 | 4.7 – 17.1 |
The widely cited clinical threshold is a cfPWV of 10 m/s (using the real, direct carotid-to-femoral distance). This cut-off was endorsed by the 2013/2018 ESC/ESH hypertension guidelines as the value above which aortic stiffness is considered to indicate subclinical organ damage and elevated cardiovascular risk. An older threshold of 12 m/s was based on a longer estimated path length (0.8 × surface distance); the 10 m/s value reflects the corrected, more accurate distance estimate.
FAQ
What is a "normal" PWV? Reference values vary by age and blood pressure. Many studies treat carotid-femoral PWV above about 10 m/s as a marker of increased risk, but interpretation depends on the reference equation you use.
Why can I change the intercept and slope? Different populations and devices produce different age-PWV regressions. Entering values from a study relevant to you (or your device's reference) makes the estimate more meaningful.
Can this diagnose disease? No. It is an educational estimate. Use it to start a conversation with a healthcare professional, not to replace clinical assessment.