
What is a Break-Even Calculator?
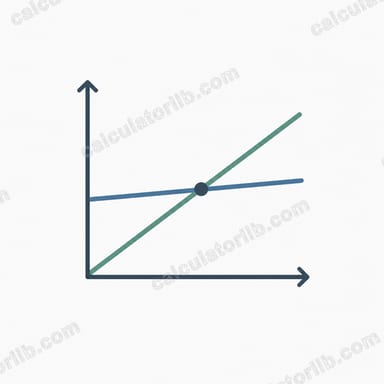
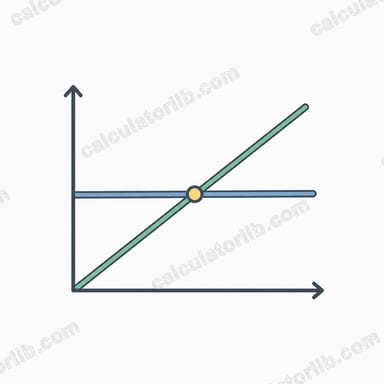
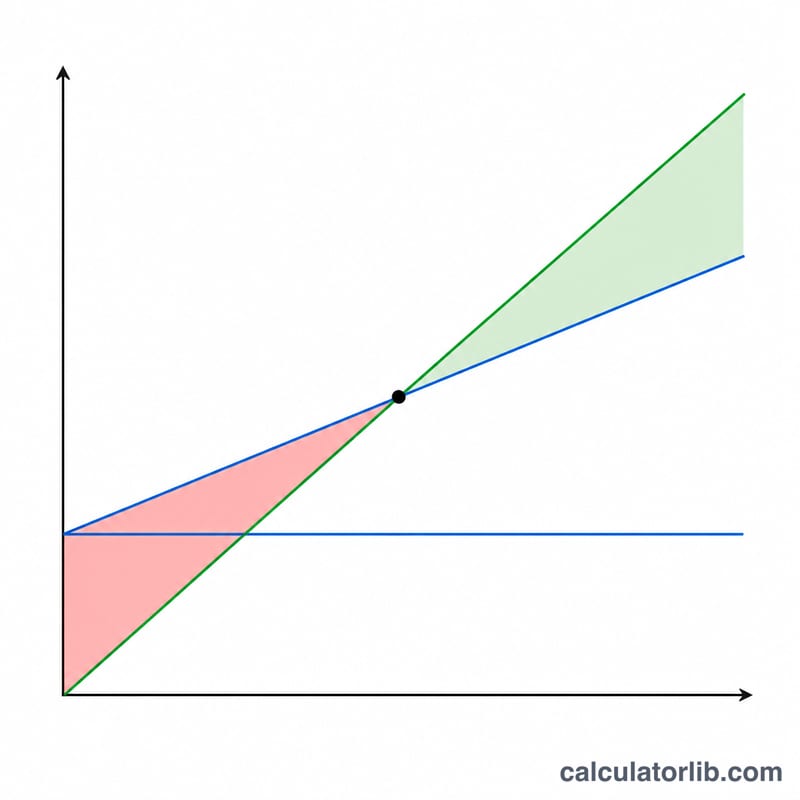
A break-even calculator is a financial tool that helps businesses determine the point at which total costs equal total revenue, resulting in neither profit nor loss. This critical threshold is known as the break-even point and is expressed in both units sold and sales revenue.
When to Use a Break-Even Calculator
- When launching a new product to determine how many units need to be sold to cover costs
- When evaluating the viability of a business project or investment
- When setting pricing strategies and analyzing how price changes affect the break-even point
How to Calculate Break-Even Point
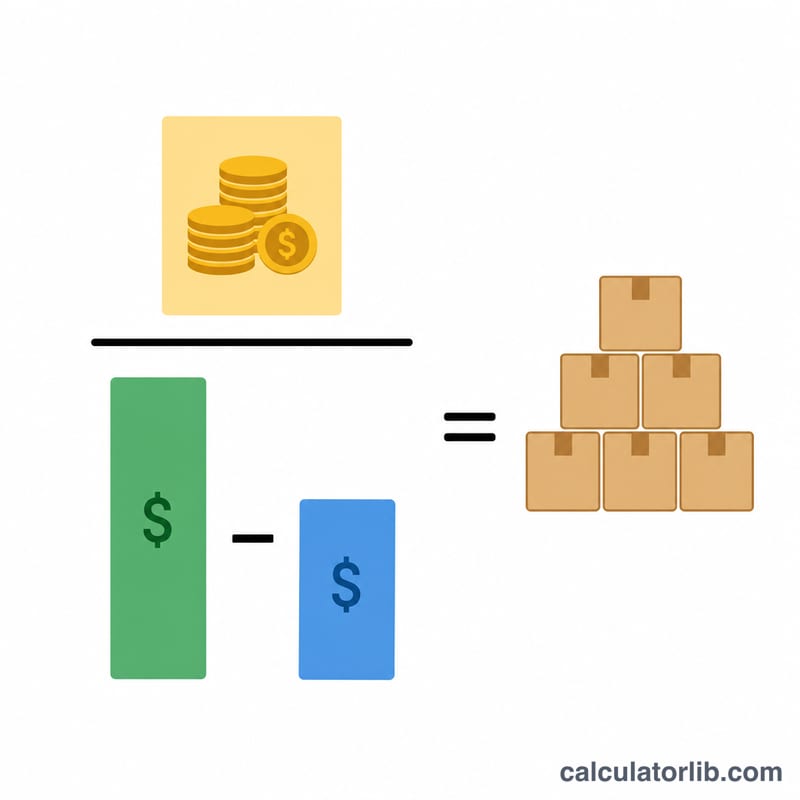
The break-even point can be calculated using the following formulas:
Contribution Margin = Selling Price - Variable Costs per Unit
Contribution Margin Ratio = Contribution Margin / Selling Price
Break-Even Point (Units) = Fixed Costs / Contribution Margin
Break-Even Point (Sales) = Break-Even Units × Selling Price
Where:
- Fixed Costs: Expenses that remain constant regardless of production volume (rent, salaries, insurance, etc.)
- Variable Costs: Expenses that change with production volume (materials, direct labor, commissions, etc.)
- Selling Price: The price at which each unit is sold to customers
Calculation Examples
Example 1: Small Retail Business
A clothing store has monthly fixed costs of $5,000. Each t-shirt costs $8 to produce and sells for $20. How many t-shirts must be sold to break even?
| Input | Value |
|---|---|
| Fixed Costs | $5,000 |
| Variable Costs per Unit | $8 |
| Selling Price per Unit | $20 |
Calculation:
- Contribution Margin = $20 - $8 = $12 per unit
- Contribution Margin Ratio = $12 / $20 = 0.6 or 60%
- Break-Even Point (Units) = $5,000 / $12 = 416.67 units (rounded to 417 units)
- Break-Even Point (Sales) = 417 × $20 = $8,340
Example 2: Manufacturing Company
A furniture manufacturer has quarterly fixed costs of $75,000. Each chair costs $45 to produce and sells for $120. What is the break-even point?
| Input | Value |
|---|---|
| Fixed Costs | $75,000 |
| Variable Costs per Unit | $45 |
| Selling Price per Unit | $120 |
Calculation:
- Contribution Margin = $120 - $45 = $75 per unit
- Contribution Margin Ratio = $75 / $120 = 0.625 or 62.5%
- Break-Even Point (Units) = $75,000 / $75 = 1,000 units
- Break-Even Point (Sales) = 1,000 × $120 = $120,000
Example 3: Service Business
A consulting firm has annual fixed costs of $200,000. Each consultation has variable costs of $75 and the service is priced at $250. How many consultations are needed to break even?
| Input | Value |
|---|---|
| Fixed Costs | $200,000 |
| Variable Costs per Unit | $75 |
| Selling Price per Unit | $250 |
Calculation:
- Contribution Margin = $250 - $75 = $175 per consultation
- Contribution Margin Ratio = $175 / $250 = 0.7 or 70%
- Break-Even Point (Units) = $200,000 / $175 = 1,142.86 consultations (rounded to 1,143)
- Break-Even Point (Sales) = 1,143 × $250 = $285,750
Understanding Break-Even Analysis
Break-even analysis helps businesses make informed decisions about pricing, production volumes, and cost management. By knowing your break-even point, you can:
- Set realistic sales targets
- Evaluate the impact of changing prices or costs
- Understand how many units must be sold before making a profit
- Assess the financial risk of business decisions
Interpreting Your Break-Even Results
The break-even point is the level of sales at which total revenue exactly equals total costs, so profit is zero. The calculator reports it two ways: as a number of units and as a dollar amount of sales. Selling more than the break-even quantity produces a profit; selling fewer units means total costs exceed revenue and the result is a loss.
The contribution margin is the selling price minus the variable cost per unit — the amount each unit "contributes" toward covering fixed costs and, after those are covered, toward profit. For example, a unit that sells for \(\$50\) with \(\$30\) of variable cost has a contribution margin of \(\$20\). If fixed costs are \(\$10{,}000\), the break-even point is 500 units.
The contribution margin ratio expresses that same margin as a percentage of the selling price (here \(\$20 \div \$50 = 40\%\)). A higher ratio means each sales dollar leaves more to cover fixed costs, so the break-even sales figure is lower; a lower ratio means more revenue is consumed by variable costs and break-even is reached more slowly.
The margin of safety compares your actual or expected sales to the break-even point. It is the cushion — in units, dollars, or percent — by which sales can fall before you drop into a loss. A wide margin of safety indicates more room to absorb a downturn; a thin margin means small declines in volume can push results below break-even.
Reading the level factually: a high break-even point (relative to capacity or realistic demand) signals that a large volume must be sold before any profit appears, which typically reflects heavy fixed costs or a small contribution margin per unit. A low break-even point means profitability begins after relatively few sales. Neither is inherently good or bad — it depends on cost structure, capacity, and the market. This is general educational information, not personal financial advice.
Key Terms and Definitions
- Fixed Costs
- Costs that do not change with the number of units produced or sold over the relevant period — for example rent, salaries, insurance, and equipment leases. They must be covered regardless of sales volume.
- Variable Cost per Unit
- The cost incurred for each additional unit produced or sold, such as materials, per-unit labor, packaging, and shipping. Total variable cost rises and falls directly with volume.
- Selling Price
- The amount of revenue received for one unit sold, before subtracting any costs.
- Contribution Margin
- Selling price minus variable cost per unit: \(\text{CM} = \text{Selling Price} - \text{Variable Cost}\). It is the per-unit amount available to cover fixed costs and then generate profit.
- Contribution Margin Ratio
- The contribution margin expressed as a fraction of the selling price: \(\text{CM Ratio} = \dfrac{\text{Selling Price} - \text{Variable Cost}}{\text{Selling Price}}\). It shows the share of each sales dollar that helps cover fixed costs.
- Break-Even Point (units)
- The number of units that must be sold for total revenue to equal total costs: \(\dfrac{\text{Fixed Costs}}{\text{Selling Price} - \text{Variable Cost}}\). Profit at this volume is zero.
- Break-Even Point (sales)
- The dollar amount of sales at which revenue equals total costs: \(\dfrac{\text{Fixed Costs}}{\text{CM Ratio}}\), or equivalently the break-even units multiplied by the selling price.
- Margin of Safety
- The amount by which actual or expected sales exceed the break-even point, stated in units, dollars, or as a percentage of sales. It measures how far sales can fall before reaching a loss.