What the Grubbs outlier test calculator does
This calculator applies Grubbs' test, also called the maximum normed residual test, to a list of measurements. It checks whether the largest value, the smallest value, or the value farthest from the mean is a single outlier. It returns the G statistic, the critical value at your significance level, and a reject / do-not-reject decision. It suits lab analysts, engineers and students who need a quick check on one suspicious reading. The method follows the NIST/SEMATECH e-Handbook definition.
How to use it
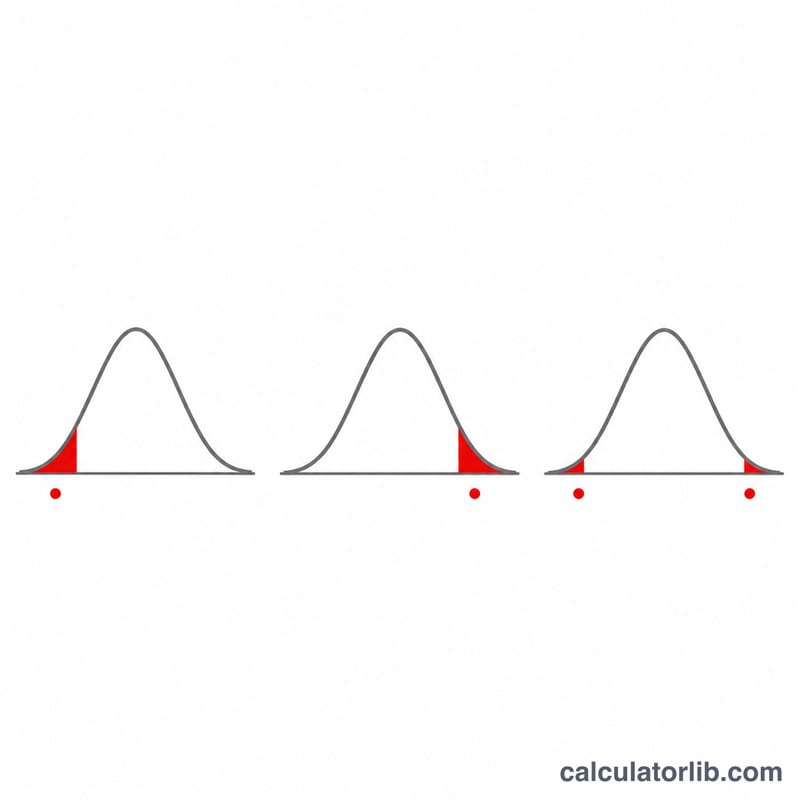
Enter the data values: at least 3 numbers separated by spaces, new lines or semicolons, with a period as the decimal mark. Choose the test type: maximum (one-sided), minimum (one-sided), or most extreme value (two-sided). Set the significance level alpha, strictly between 0 and 1, typically 0.05. The result shows the suspect value, N, mean, sample standard deviation, G, the critical value and the decision.
Formula
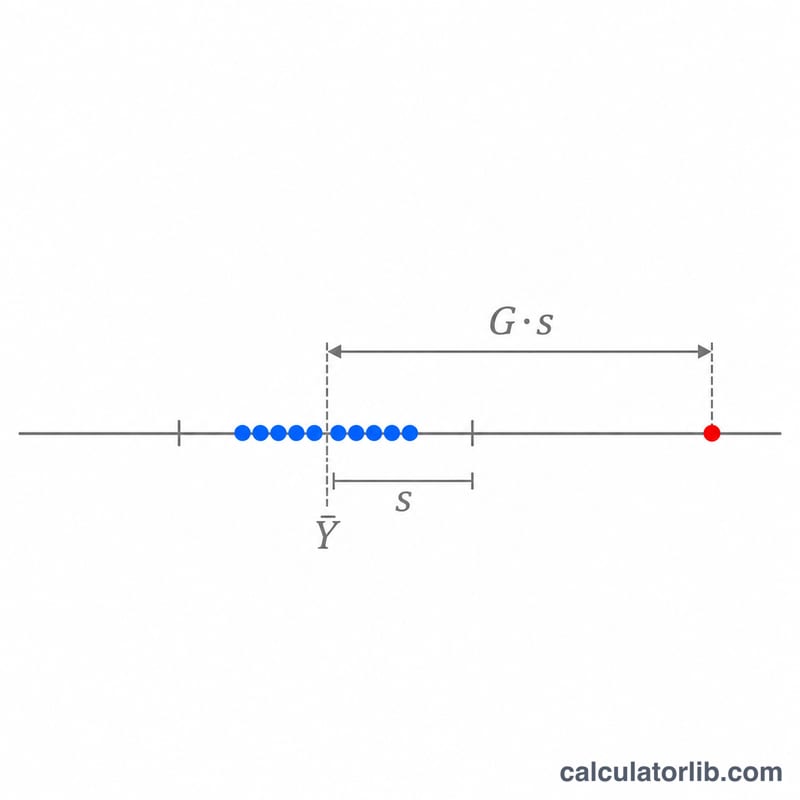
For the sample \(Y_1,\dots,Y_N\), with mean \(\bar Y\) and sample standard deviation \(s\), the statistic depends on the test type:
$$G=\frac{\max|Y_i-\bar Y|}{s}\quad\text{(two-sided)},\qquad G=\frac{Y_{max}-\bar Y}{s},\qquad G=\frac{\bar Y-Y_{min}}{s}$$
The critical value is:
$$G_{crit}=\frac{N-1}{\sqrt{N}}\sqrt{\frac{t^2}{N-2+t^2}}$$
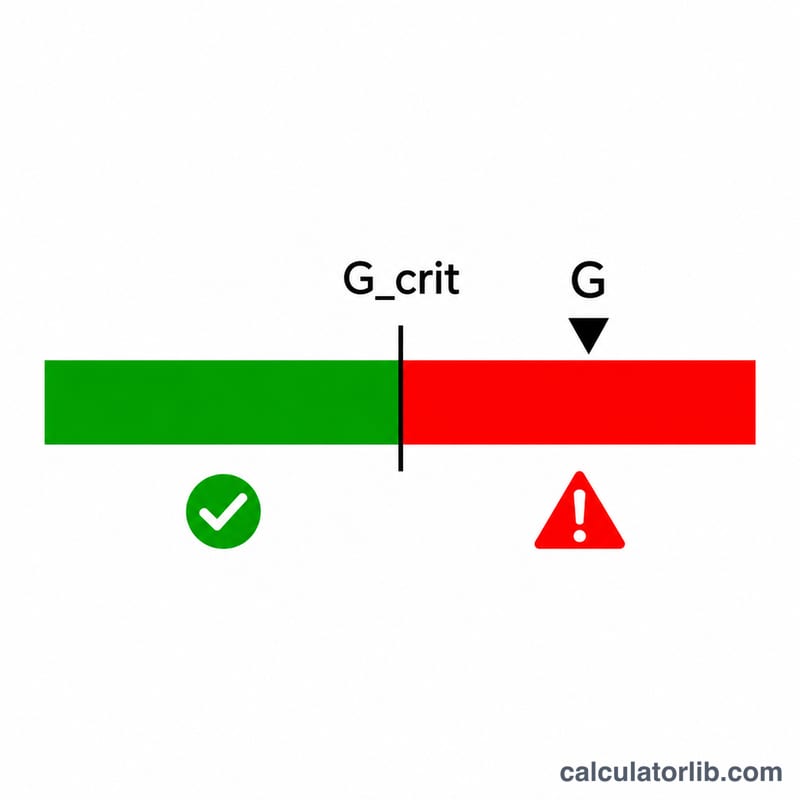
Here \(t\) is the upper-tail critical value of Student's t distribution with \(N-2\) degrees of freedom, where \(P(T>t)=\alpha/(2N)\) for the two-sided test and \(\alpha/N\) for the one-sided tests. The null hypothesis of no outlier is rejected when \(G>G_{crit}\).
Conventions and assumptions
- The standard deviation is the sample form with \(N-1\) in the denominator. This reproduces the NIST example.
- The decision is strict: G equal to the critical value is not rejected.
- The t quantile is found numerically from the regularized incomplete beta function to a relative tolerance of \(10^{-12}\).
- Calculations use full double precision; G and the critical value are displayed to 4 decimals.
- The test covers one outlier only. If several outliers are suspected, use the Tietjen-Moore test or the generalized ESD test.
- The data should be approximately normal. Between 3 and 5000 values are accepted, and they must not all be identical.
Worked example
The NIST uranium isotope data are 199.31, 199.53, 200.19, 200.82, 201.92, 201.95, 202.18 and 245.57, tested as a maximum at \(\alpha=0.05\). Here \(N=8\), \(\bar Y=206.43375\) and \(s=15.852564\).
$$G=\frac{245.57-206.43375}{15.852564}=2.4688$$
The tail probability is \(\alpha/N=0.05/8=0.00625\), and the critical value is:
$$G_{crit}=2.0317$$
Since \(2.4688>2.0317\), H0 is rejected: 245.57 is declared an outlier.
How to read the result and limitations
A rejection means the suspect value is unlikely to come from the same normal population as the rest at the chosen level. It does not say why the value is extreme; check for recording errors or a real process change before removing it. A non-rejection means there is not enough evidence of an outlier. Small samples have little power. Masking can hide an outlier when a second extreme value is present. Do not apply the test repeatedly to the same data set, because this changes the error rates.
FAQ
When should I use the two-sided option?
Use it when the suspect could be either end of the data. Use a one-sided test only when you decided before looking at the data that only high or only low values are of concern.
Why is the critical value based on alpha divided by N?
The test looks at the most extreme of N values, so a Bonferroni-type adjustment is used to keep the overall error rate at alpha.
What if I think there are two outliers?
Grubbs' test handles only one. Use the Tietjen-Moore test or the generalized ESD test instead.
Why must data be roughly normal?
The critical value comes from the t distribution, which assumes normally distributed observations. Skewed data can produce false outliers.
What is the largest possible G?
It is \((N-1)/\sqrt{N}\). For N = 3 this is 1.1547, so the critical value is close to that bound.
Sources
- 1.3.5.17.1. Grubbs' Test for Outliers – NIST/SEMATECH e-Handbook of Statistical Methods