What the Kruskal–Wallis calculator does
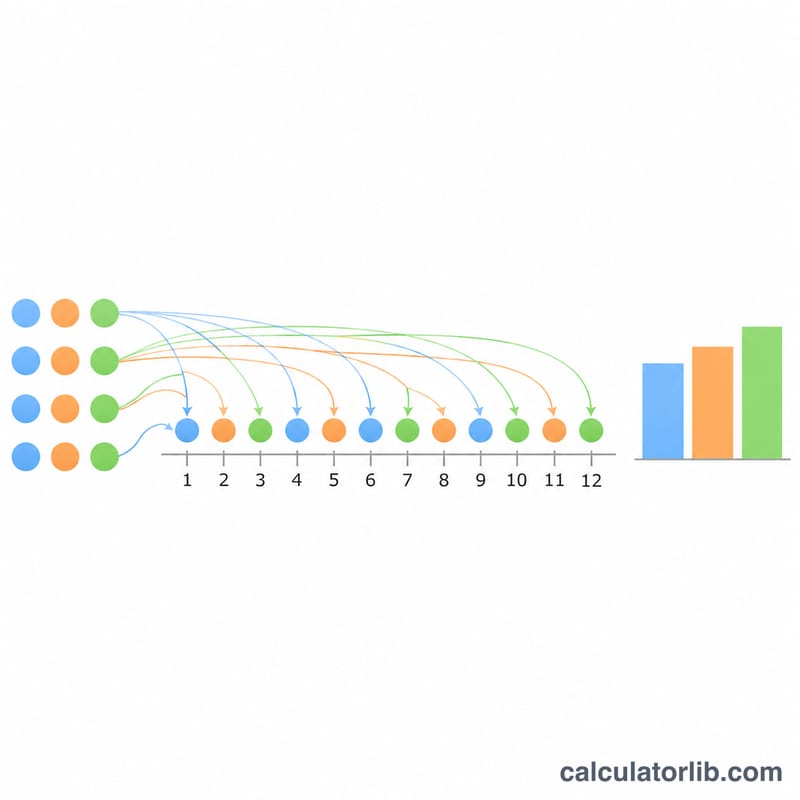
The Kruskal–Wallis test is a rank-based, one-factor test of whether k independent samples come from identical populations. It is the non-parametric counterpart of one-way ANOVA and is used when data are ordinal, skewed or contain outliers. The calculator pools the observations, assigns ranks (average ranks for ties), computes the rank sums, the tie-corrected H statistic, the chi-square p-value, the critical value and a reject or retain decision.
How to use it
Enter the observations for Group 1, Group 2 and Group 3 as numbers separated by commas, semicolons or spaces. Groups 1 to 3 are required. Groups 4, 5 and 6 are optional: type - in any group that is not used. Then set the significance level alpha (default 0.05). Group sizes may differ, group order does not change H, and the total may not exceed 5000 observations.
Formula
Without ties the statistic is
$$H_0=\frac{12}{n(n+1)}\sum_{i=1}^{k}\frac{R_i^2}{n_i}-3(n+1)$$where \(n_i\) = observations in group i, \(R_i\) = rank sum of group i, \(n\) = total observations and \(k\) = number of groups. With ties:
$$C=1-\frac{\sum_j (t_j^3-t_j)}{n^3-n},\qquad H=\frac{H_0}{C}$$where \(t_j\) = size of the j-th group of tied values. The p-value is
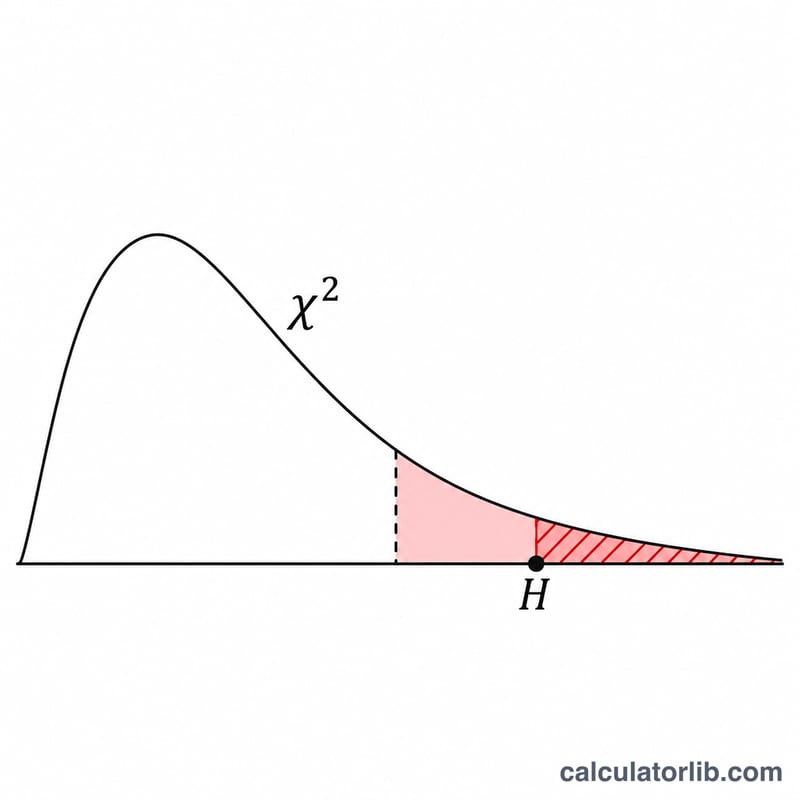
$$p=P(\chi^2_{k-1}\ge H)$$The test rejects the null hypothesis when H exceeds the chi-square percent point at 1 − alpha with k − 1 degrees of freedom.
Conventions and assumptions
- Tied values receive the average of the ranks they span. The reported H is the tie-corrected value, equal to the uncorrected H when there are no ties. The tie correction is the standard Conover/Kruskal–Wallis form, chosen as a design decision because the NIST page does not print it.
- H is compared with a chi-square distribution with k − 1 degrees of freedom, using the upper tail.
- Decision rule: reject H0 if H is above the critical value. Default alpha is 0.05.
- If any group has fewer than 5 observations, a small-sample warning is shown because the chi-square approximation may be unreliable. The result is still computed.
- If all values are identical, C = 0 and H is undefined, so the calculator reports an error. At least two groups are needed. H = 0 gives p = 1.
- Raw values are used internally. Display: H, p, critical value and C to 4 decimals, rank sums to 1 decimal.
Worked example
Three groups of six values: Group 1 = 27, 2, 4, 18, 7, 9; Group 2 = 20, 8, 14, 36, 21, 22; Group 3 = 34, 31, 3, 23, 30, 6; alpha = 0.05. Here \(n=18\), \(k=3\), and there are no ties.
$$R_1=39.0,\quad R_2=65.0,\quad R_3=67.0$$$$H_0=\frac{12}{18\times 19}\left(\frac{39^2}{6}+\frac{65^2}{6}+\frac{67^2}{6}\right)-3\times 19=2.8538$$The tie factor is \(C=1\), so \(H=2.8538\) (the same as before correction). Degrees of freedom are 2, the p-value is 0.2401 and the critical value is 5.9915. Since 2.8538 is below 5.9915, H0 is not rejected. No small-sample warning applies because each group has 6 observations.
Reading the result and limitations
A small p-value (below alpha) suggests at least one group tends to give larger or smaller values than another. The test does not say which groups differ; follow a significant result with pairwise comparisons. It assumes independent samples and, for an interpretation as a difference in medians, similarly shaped distributions. With groups smaller than 5, exact tables are preferable to the chi-square approximation.
FAQ
When should I use Kruskal–Wallis instead of ANOVA?
Use it when normality is doubtful, data are ordinal, or outliers are present.
How are ties handled?
Tied values share the average of their ranks, and H is divided by the correction factor C.
What does the small-sample warning mean?
At least one group has fewer than 5 values, so the chi-square p-value is only approximate.
Can I use unequal group sizes?
Yes. The formula weights each rank sum by its own group size.
Why do I need to type - for unused groups?
A blank field is replaced with its default, so the dash marks a group as unused. Only groups 4 to 6 can be unused.
Sources
- Dataplot KRUSKAL WALLIS command reference, NIST Information Technology Laboratory, 2023