What the Levene test calculator does
Levene's test checks whether two or more groups share the same variance, a condition called homogeneity of variance. Many procedures, including ANOVA and the pooled two-sample t-test, assume it. The calculator takes raw data for each group, computes the W statistic, the degrees of freedom, the upper-tail p-value from the F distribution, the critical value at your chosen significance level, and a reject or do-not-reject decision. It suits students, analysts and researchers who need to check this assumption before further testing.
How to use it
Enter the data in the first field. Separate groups with a semicolon and values within a group with commas, for example 6,8,4;12,15,7 for two groups. Each group needs at least two values, and every token must be a number. Next choose the center used for the deviations: the median (Brown-Forsythe variant, recommended) or the mean (original Levene). Finally set the significance level alpha, between 0.0001 and 0.5; 0.05 is the default.
The formula
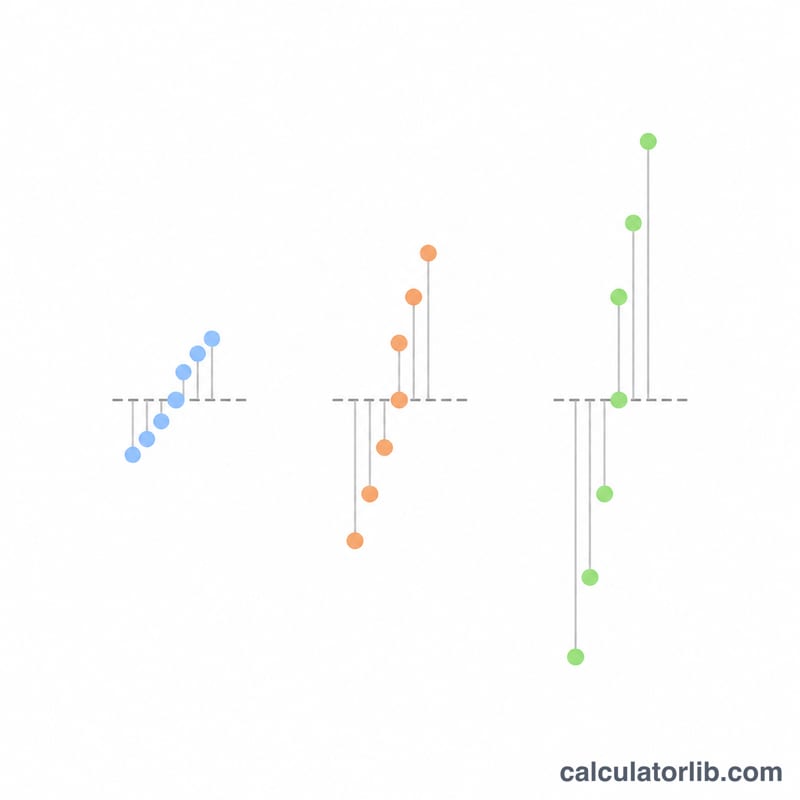
Each observation is converted to an absolute deviation from its group center, and W compares the spread of those deviations between and within groups.
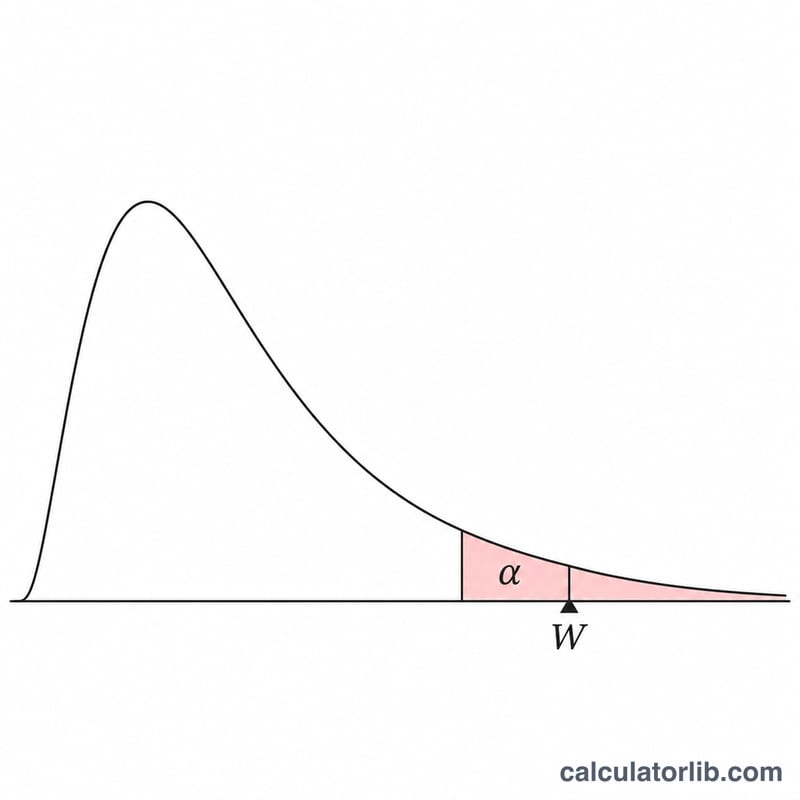
$$Z_{ij} = |Y_{ij} - c_i|$$$$W = \frac{N-k}{k-1} \times \frac{\sum_{i=1}^{k} N_i\,(\bar{Z}_i - \bar{Z})^2}{\sum_{i=1}^{k}\sum_{j=1}^{N_i} (Z_{ij} - \bar{Z}_i)^2}$$Here \(k\) = number of groups, \(N_i\) = size of group \(i\), \(N\) = total observations, \(c_i\) = group mean or median, \(\bar{Z}_i\) = mean of the deviations in group \(i\), and \(\bar{Z}\) = mean of all deviations. The null hypothesis of equal variances is rejected when \(W > F(\alpha, k-1, N-k)\).
Conventions and assumptions
- The center is the median by default and the mean as an option. A trimmed mean is not offered, because its trimming rule is not defined in the source.
- The median of an even-sized group is the average of the two middle sorted values.
- Degrees of freedom are \(k-1\) for the numerator and \(N-k\) for the denominator.
- The p-value is the upper tail \(P(F \ge W)\), computed with the regularized incomplete beta function.
- The decision uses a strict inequality: W equal to the critical value does not reject.
- Values are not rounded internally. W and the p-value are shown to 6 decimals and the critical value to 4.
- Limits: 2 to 50 groups, at least 2 values per group, at most 5000 values. If deviations do not vary within groups, W is undefined.
Worked example
Three groups are entered: 6,8,4,5,9; 12,15,7,20,3; and 5,6,5,7,6. The center is the median and \(\alpha = 0.05\). Then \(k = 3\) and \(N = 15\).
$$df_1 = k-1 = 2,\quad df_2 = N-k = 12$$$$W = 5.284768$$$$p = 0.022592,\quad F_{0.05,\,2,\,12} = 3.8853$$Because \(5.284768 > 3.8853\), equivalently \(p = 0.022592 < 0.05\), the test rejects equal variances.
How to read the result
A small p-value, or a W above the critical value, is evidence that at least one group differs in variance. A large p-value means the data give no clear evidence of unequal variances; it does not prove they are equal, especially with small samples. The median variant is more robust to skewed data, while the mean variant can behave differently and may lead to another decision. With two groups the test equals a two-sample t-test on the deviations, with \(W = t^2\). The test is only as good as the data entered, so check for entry mistakes and outliers first.
FAQ
Which center should I choose?
The median is the default and is recommended for its robustness and good power. The mean reproduces the original Levene test.
Can groups have different sizes?
Yes. Unequal group sizes are allowed, provided each group has at least two values.
What does the p-value mean?
It is the probability of an F value at least as large as W if all variances were equal. Reject when it is below alpha.
Why does the calculator report an undefined statistic?
If the deviations within every group are identical, the denominator of W is zero and the statistic cannot be computed.
Does a non-significant result prove equal variances?
No. It only means the data do not show a significant difference at the chosen level.
Sources
- 1.3.5.10. Levene Test for Equality of Variances, NIST/SEMATECH e-Handbook of Statistical Methods