
What this calculator does
This tool estimates take-home pay in the Republic of Ireland for the 2024, 2025 or 2026 tax year (2026 by default). From your gross annual salary it works out the three deductions on an Irish payslip: PAYE income tax, the Universal Social Charge (USC) and Class A PRSI. It is an estimate for employees and does not cover self-assessment, rental income, pension relief or every credit available.
How to use it
Enter your gross annual income, choose the status that sets your standard rate cut-off, enter your total annual tax credits and pick the tax year. A single PAYE employee in 2025 or 2026 usually has €4,000 of credits (€2,000 personal + €2,000 employee credit); in 2024 it was €3,750.
The formula explained
Income tax is 20% up to the standard rate cut-off (C) and 40% above it, minus your credits. For 2025 and 2026 the cut-off is €44,000 (single), €48,000 (single parent), €53,000 (married, one income) and up to €88,000 (married, two incomes); in 2024 it was €42,000, €46,000, €51,000 and €84,000. USC in 2026 is 0.5% up to €12,012, 2% to €28,700, 3% to €70,044 and 8% above (2025: 2% to €27,382; 2024: 2% to €25,760 and 4% instead of 3%); there is no USC if total income is €13,000 or less. Employee PRSI is 4.2% until 30 September 2026 and 4.35% from 1 October 2026, so the year is costed at 4.2375% (2025: 4.1% then 4.2%; 2024: 4.0% then 4.1%); there is no PRSI on weekly pay of €352 or less.
$$\text{Net} = I - \left(\text{Tax} + \text{USC} + \text{PRSI}\right), \quad \text{Tax} = \max\left(0,\ 0.20\,\min(I, C) + 0.40\,\max(0, I - C) - \text{Credits}\right)$$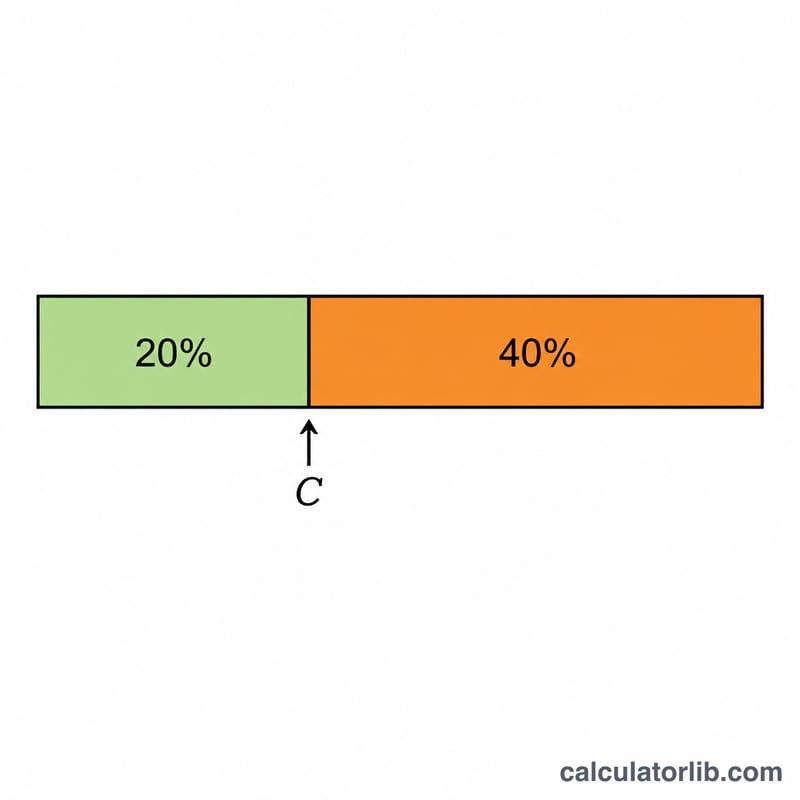
Worked example
Single, €45,000, €4,000 of credits, tax year 2026: tax = €44,000 × 20% + €1,000 × 40% − €4,000 = €5,200. USC = €60.06 + €333.76 + €489.00 = €882.82. PRSI = €45,000 × 4.2375% = €1,906.88. Total deductions €7,989.70, leaving net pay of €37,010.31.
Income and jobs: Ireland
Average income and unemployment in Ireland compared with the world, from the World Bank: a benchmark for the figures you enter above.
- GNI per capita 2025
- 87,360 USD
- GDP per capita, PPP 2025
- 155,089 intl. $
- World: 25,704
- Unemployment 2025
- 4.6%
- World: 4.8%
Latest change Up +8.3% 2025: 87,360 USD, against 80,650 USD in 2024. CalculatorLib computes this change from the two published figures.
In 2025, gross national income per person in Ireland was 87,360 US dollars a year, about 7,280 US dollars a month. World: 14,244 USD
| Year | GNI per capita (USD) | GDP per capita, PPP (intl. $) | Unemployment |
|---|---|---|---|
| 2025 | 87,360 | 155,089 | 4.6% |
| 2024 | 80,650 | 140,779 | 4.3% |
| 2023 | 79,280 | 133,440 | 4.2% |
| 2022 | 75,970 | 138,465 | 4.5% |
| 2021 | 74,070 | 116,703 | 6.4% |
| 2020 | 64,420 | 97,677 | 5.6% |
| 2019 | 62,460 | 92,042 | 5.0% |
| 2018 | 59,110 | 86,369 | 5.7% |
| 2017 | 54,410 | 80,409 | 6.7% |
| 2016 | 52,880 | 72,941 | 8.4% |
GNI per capita (Atlas method) is the average of all income in the economy, not a typical salary; PPP dollars adjust for local prices.
Income tax and social security: Ireland
- Top income tax rate 2025
- 48%
- from 1.2 × the average wage
- Employee social security 2025
- 4.1%
In 2025, the top statutory personal income tax rate in Ireland (central and local government combined) was 48%. It applies from 1.2 times the average wage of 60,258 EUR, that is from about 70,045 EUR a year.
Top income tax rates in OECD countries
| Country | Top rate | Applies from (× average wage) | Year |
|---|---|---|---|
| Japan | 55.95% | 7.7 | 2025 |
| France | 55.37% | 12.9 | 2025 |
| South Korea | 49.5% | 19.0 | 2025 |
| Ireland | 48% | 1.2 | 2025 |
| Germany | 47.48% | 4.4 | 2025 |
| United Kingdom | 45% | 2.2 | 2025 |
| United States | 43.65% | 8.7 | 2025 |
| Türkiye | 40.76% | 5.6 | 2025 |
| Mexico | 35% | 20.6 | 2025 |
The top rate is the statutory rate on the highest earnings, not the rate most workers pay. OECD figures cover OECD member countries only.
Ireland and other countries
GNI per capita in current US dollars (Atlas method) — each country’s latest published year.
- United States 88,810 USD (2025)
- Ireland 87,360 USD (2025)
- France 48,630 USD (2025)
- Japan 38,340 USD (2025)
- South Korea 37,880 USD (2025)
- Saudi Arabia 36,070 USD (2025)
- Türkiye 16,300 USD (2025)
- Russia 15,960 USD (2025)
- World 14,244 USD (2025)
- China 14,230 USD (2025)
- Mexico 13,730 USD (2025)
- Vietnam 4,970 USD (2025)
- India 2,760 USD (2025)
Years can differ between rows: each figure is shown with its own year. The same World Bank indicator for every country.
Latest figure: 2025 Data last updated 2026-10-18 · current
Source: The World Bank Group CC BY 4.0; OECD, Tax Database CC BY 4.0
Monthly figures are computed by CalculatorLib from these data. The top-rate threshold in national currency (multiple × average wage) is computed by CalculatorLib from these data.
Source details and methodology
- The World Bank Group — World Development Indicators (NY.GNP.PCAP.CD, NY.GDP.PCAP.PP.CD, SL.UEM.TOTL.ZS)
- OECD, Tax Database — Top statutory personal income tax rate; employee social security contribution rates
FAQ
Is this official? No. It is an estimate for guidance only. Check Revenue.ie or your payslip for exact figures.
Which year does it use? 2026 by default. You can choose 2025 or 2024, and each year uses its own cut-offs, USC bands and PRSI rate.
Does it include pension contributions? No. Pension contributions reduce taxable income and would lower your bill; this calculator uses gross income directly.