
What this calculator does
The Gross Salary Needed for Target Take-Home Calculator works backwards from the amount you actually want to keep. Instead of starting with a salary offer and computing what's left after tax, you enter the net (take-home) pay you need and your effective tax and deduction rate, and it tells you the gross salary required to land there. This is useful when negotiating a job offer, setting a freelance rate, or planning a budget around a fixed spending target.
How to use it
Enter your target take-home pay — the money you want in your pocket after everything is withheld. Then enter your effective tax and deduction rate as a percentage. This single combined rate should bundle income tax, social contributions, and any other percentage-based deductions. The calculator returns the gross salary you must earn, plus the total amount that goes to taxes and deductions.
The formula explained
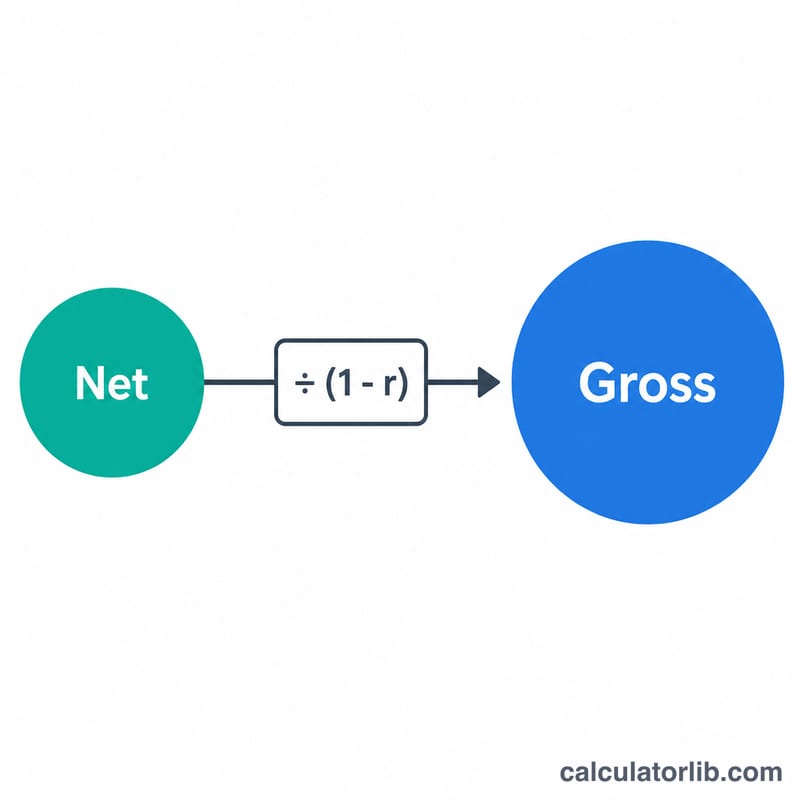
The math is simple algebra. If your net is whatever remains after a fraction r of gross is removed, then \(\text{Net} = \text{Gross} \times (1 - r)\). Rearranging to solve for gross gives:
$$\text{Gross} = \frac{\text{Net}}{1 - r}$$
Here r is the effective rate written as a decimal (\(25\% = 0.25\)). The denominator \((1 - r)\) is the "keep rate" — the share of each dollar you actually retain.

Worked example
Suppose you want to take home 50,000 per year and your effective rate is 25%. Then \(r = 0.25\) and \(1 - r = 0.75\). $$\text{Gross} = 50{,}000 \div 0.75 = 66{,}666.67$$ Total deductions \(= 66{,}666.67 - 50{,}000 = 16{,}666.67\). So you'd need a gross salary of about 66,667 to keep 50,000.
Income and jobs: United States
Average income and unemployment in United States compared with the world, from the World Bank: a benchmark for the figures you enter above.
- GNI per capita 2025
- 88,810 USD
- GDP per capita, PPP 2025
- 90,027 intl. $
- World: 25,704
- Unemployment 2025
- 4.2%
- World: 4.8%
Latest change Up +7.1% 2025: 88,810 USD, against 82,910 USD in 2024. CalculatorLib computes this change from the two published figures.
In 2025, gross national income per person in United States was 88,810 US dollars a year, about 7,401 US dollars a month. World: 14,244 USD
| Year | GNI per capita (USD) | GDP per capita, PPP (intl. $) | Unemployment |
|---|---|---|---|
| 2025 | 88,810 | 90,027 | 4.2% |
| 2024 | 82,910 | 86,170 | 4.0% |
| 2023 | 79,950 | 82,587 | 3.6% |
| 2022 | 77,230 | 78,009 | 3.7% |
| 2021 | 71,510 | 71,441 | 5.3% |
| 2020 | 64,630 | 64,465 | 8.1% |
| 2019 | 65,840 | 65,228 | 3.7% |
| 2018 | 63,040 | 62,876 | 3.9% |
| 2017 | 58,860 | 60,048 | 4.4% |
| 2016 | 56,830 | 57,977 | 4.9% |
GNI per capita (Atlas method) is the average of all income in the economy, not a typical salary; PPP dollars adjust for local prices.
Income tax and social security: United States
- Top income tax rate 2025
- 43.65%
- from 8.7 × the average wage
- Employee social security 2025
- 7.65% · 1.45%
In 2025, the top statutory personal income tax rate in United States (central and local government combined) was 43.65%. It applies from 8.7 times the average wage of 73,520 USD, that is from about 642,101 USD a year.
Employee social security contribution rates for successive earnings bands, lowest band first; the band limits are not shown.
Top income tax rates in OECD countries
| Country | Top rate | Applies from (× average wage) | Year |
|---|---|---|---|
| Japan | 55.95% | 7.7 | 2025 |
| France | 55.37% | 12.9 | 2025 |
| South Korea | 49.5% | 19.0 | 2025 |
| Germany | 47.48% | 4.4 | 2025 |
| United Kingdom | 45% | 2.2 | 2025 |
| United States | 43.65% | 8.7 | 2025 |
| Türkiye | 40.76% | 5.6 | 2025 |
| Mexico | 35% | 20.6 | 2025 |
The top rate is the statutory rate on the highest earnings, not the rate most workers pay. OECD figures cover OECD member countries only.
United States and other countries
GNI per capita in current US dollars (Atlas method) — each country’s latest published year.
- United States 88,810 USD (2025)
- France 48,630 USD (2025)
- Japan 38,340 USD (2025)
- South Korea 37,880 USD (2025)
- Saudi Arabia 36,070 USD (2025)
- Türkiye 16,300 USD (2025)
- Russia 15,960 USD (2025)
- World 14,244 USD (2025)
- China 14,230 USD (2025)
- Mexico 13,730 USD (2025)
- Vietnam 4,970 USD (2025)
- India 2,760 USD (2025)
No published figure yet for Taiwan.
Years can differ between rows: each figure is shown with its own year. The same World Bank indicator for every country.
Latest figure: 2025 Data last updated 2026-10-18 · current
Source: The World Bank Group CC BY 4.0; OECD, Tax Database CC BY 4.0
Monthly figures are computed by CalculatorLib from these data. The top-rate threshold in national currency (multiple × average wage) is computed by CalculatorLib from these data.
Source details and methodology
- The World Bank Group — World Development Indicators (NY.GNP.PCAP.CD, NY.GDP.PCAP.PP.CD, SL.UEM.TOTL.ZS)
- OECD, Tax Database — Top statutory personal income tax rate; employee social security contribution rates
FAQ
Is this for a specific country? No — it is currency- and country-neutral. You supply your own effective rate, so it works anywhere as long as your deductions are roughly proportional.
What is an "effective" tax rate? It's your total taxes and deductions divided by gross income, not your top marginal bracket. With progressive taxes the effective rate is usually lower than the marginal rate.
Why can't the rate be 100%? At a 100% rate the keep rate is zero, meaning no gross salary could ever produce take-home pay, so the formula is undefined. The calculator caps the rate below 100%.