What This Calculator Does
The Savings Needed for Target Passive Income Calculator tells you how large a portfolio you must build to live off its returns. Enter the annual income you want to receive without working, plus the yield or rate of return you realistically expect, and it instantly shows the principal required.
How to Use It
Type your desired annual passive income (for example, $40,000). Enter the expected annual yield as a percentage — dividends, interest, or a safe withdrawal rate such as 4%. The calculator divides your income goal by the decimal yield to reveal the nest egg you need, and also shows the equivalent monthly income.
The Formula Explained
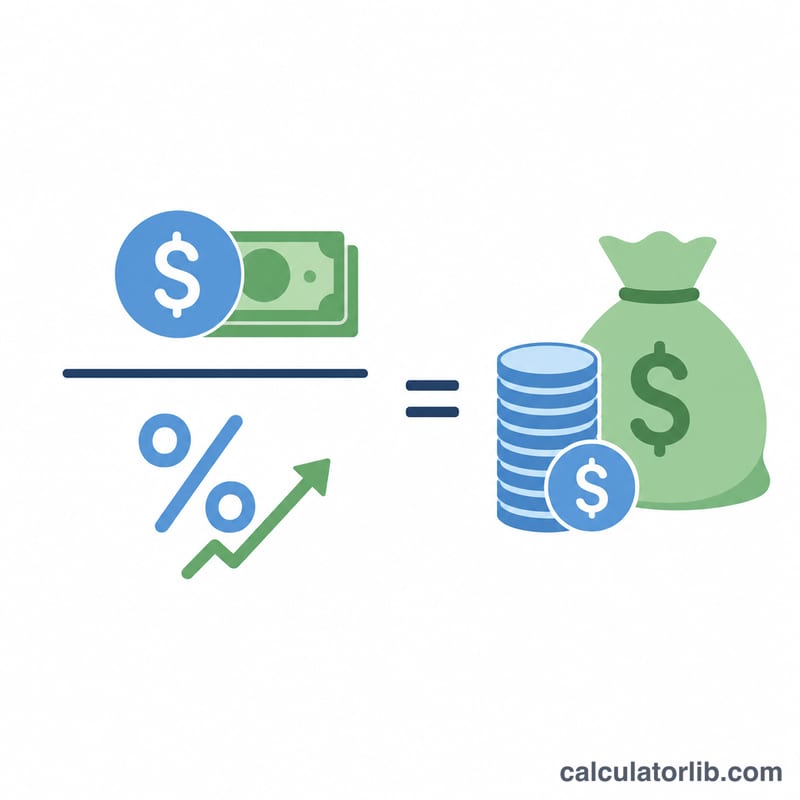
The core relationship is $$\text{Principal} = \frac{\text{Annual Income}}{\text{Annual Yield}}$$ The yield is expressed as a decimal, so 4% becomes \(0.04\). A higher yield means you need less capital; a lower yield means you need more. This is the same logic behind the popular "4% rule" used in retirement planning, where withdrawing 4% per year implies you need 25× your annual spending.
Worked Example
Suppose you want $40,000 per year and expect a 4% yield. $$\text{Principal} = \frac{40{,}000}{0.04} = \mathbf{\$1{,}000{,}000}$$ That equals $3,333.33 of monthly income. If your expected yield were 5% instead, you would need \(40{,}000 \div 0.05 = \$800{,}000\).
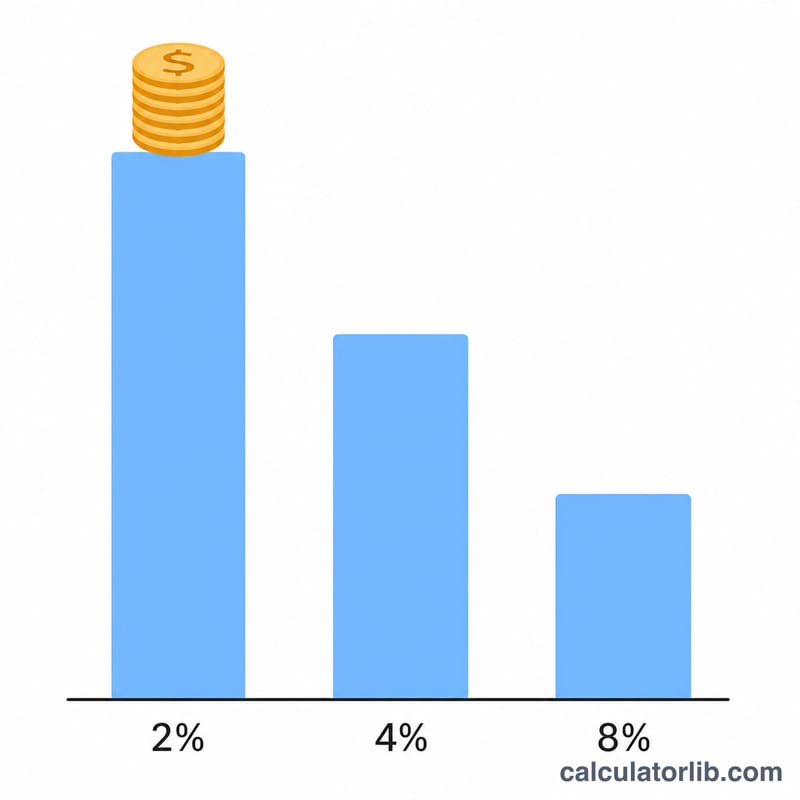
Required Principal at Different Income Goals and Yields
Required principal is the target annual income divided by the yield as a decimal: \(\text{Principal} = \text{Income} \div \text{Yield}\). The table shows gross (pre-tax, pre-inflation) figures, rounded to the nearest dollar.
| Target annual income | 3% yield (33.3×) | 4% yield (25×) | 5% yield (20×) | 6% yield (16.7×) |
|---|---|---|---|---|
| $20,000 | $666,667 | $500,000 | $400,000 | $333,333 |
| $30,000 | $1,000,000 | $750,000 | $600,000 | $500,000 |
| $40,000 | $1,333,333 | $1,000,000 | $800,000 | $666,667 |
| $60,000 | $2,000,000 | $1,500,000 | $1,200,000 | $1,000,000 |
| $100,000 | $3,333,333 | $2,500,000 | $2,000,000 | $1,666,667 |
Example with full substitution: \(\$40{,}000 \div 0.04 = \$1{,}000{,}000\), which is 25 times the annual income.
Typical Yield and Withdrawal Rate Ranges
The ranges below are general reference points that change over time. They are not guarantees or forecasts.
- Safe withdrawal rates: About 3–4% is commonly cited. This stems from William Bengen's 1994 research (the "4% rule") and the later Trinity study, which looked at historical U.S. stock and bond portfolios over roughly 30-year retirements. Results depend heavily on the time horizon, asset allocation, and the historical data and assumptions used. Longer horizons, such as early retirement, are often analyzed with lower rates.
- Broad-market dividend yields: Diversified stock index dividend yields have roughly ranged from about 1.5% to 4%, depending on the market and the period. Individual stocks and funds can fall well outside this range.
- High-yield savings, CDs, and bonds: These yields follow prevailing interest rates, which rise and fall with central bank policy and economic conditions. Check current published rates rather than relying on past figures.
A withdrawal rate (drawing down principal and returns) and a yield (income paid by the asset) are different things, so be clear which one you enter into the calculator.
Interpreting Your Result
The result is a gross, pre-tax capital target. It shows the principal that would produce your target income at the yield you entered, before taxes, fees, and inflation.
It also equals a multiple of your annual income: \(\text{Multiple} = 1 \div \text{Yield}\). A 4% yield means 25×, 5% means 20×, and 3% means about 33.3×.
Lower yields raise the required principal sharply. For $40,000 of income, a 5% yield needs $800,000, while a 3% yield needs about $1,333,333, which is roughly $533,000 more for a two-point drop.
Adjusting for taxes: use a net yield, where \(\text{Net yield} = \text{Yield} - \text{Tax drag}\). If a 4% yield is taxed at an effective 20%, the tax drag is \(4\% \times 0.20 = 0.8\%\), so the net yield is \(4\% - 0.8\% = 3.2\%\). To net $40,000 you would need \(\$40{,}000 \div 0.032 = \$1{,}250{,}000\) instead of $1,000,000. Tax treatment varies by country and account type.
Adjusting for inflation: the real yield is approximately \(\text{Nominal yield} - \text{Inflation}\). With a 4% nominal yield and 2.5% inflation, the real yield is about 1.5%. If you want to spend only the real portion so that the principal keeps its purchasing power, the target becomes \(\$40{,}000 \div 0.015 \approx \$2{,}666{,}667\). This is a conservative illustration, and many plans instead allow the principal to grow with the market.
This is general information, not professional financial advice. Actual returns are uncertain, and a qualified adviser can help with personal circumstances.
Central bank policy rates today
The latest official policy rates of major central banks, updated automatically — the benchmark that bank deposit and loan rates follow.
- Federal Reserve · United States
- 3.75–4.00%
- As of
- 2026-11-12
- Change in 1 year
- 0 pp
Latest change Up +25 bp Federal Reserve changed its rate on 2026-09-17: from 3.50–3.75% to 3.75–4.00%.
| Central bank | Policy rate | As of | Change in 1 year |
|---|---|---|---|
| Banco Central do Brasil (Selic) · Brazil | 13.75% | 2026-11-15 | −1.25 pp |
| Banco de México · Mexico | 6.25% | 2026-11-10 | −1.00 pp |
| Federal Reserve · United States | 3.75–4.00% | 2026-11-12 | 0 pp |
| ECB | 2.50% | 2026-11-16 | +0.50 pp |
| Sveriges Riksbank · Sweden | 2.00% | 2026-11-16 | +0.25 pp |
| Saudi Central Bank (SAMA) · Saudi Arabia | 4.50% | 2026-10-29 | 0 pp |
| Reserve Bank of Australia · Australia | 4.60% | 2026-10-31 | +1.00 pp |
| Central Bank of the Republic of Türkiye · Türkiye | 36.00% | 2026-11-06 | −3.50 pp |
| Bank of Russia · Russia | 14.00% | 2026-11-10 | −2.50 pp |
| People’s Bank of China · China | 3.00% | 2026-11-10 | 0 pp |
| Bank of Canada · Canada | 2.50% | 2026-11-13 | +0.25 pp |
| Reserve Bank of India · India | 5.50% | 2026-10-19 | 0 pp |
| Bank of England · United Kingdom | 4.00% | 2026-11-16 | 0 pp |
| Bank of Japan · Japan | 1.25% | 2026-11-10 | +0.75 pp |
| Bank of Korea · South Korea | 3.00% | 2026-11-02 | +0.50 pp |
Federal Reserve: key rates and overnight market rates
The rates that frame monetary policy and the overnight market rate they steer, each with the date of its latest published value.
| Rate | Level | As of | Change in 1 year |
|---|---|---|---|
| Federal funds target range | 3.75–4.00% | 2026-11-13 | 0 pp |
| Effective federal funds rate (EFFR) | 3.88% | 2026-11-13 | 0 pp |
| Secured Overnight Financing Rate (SOFR) | 3.90% | 2026-11-13 | −0.10 pp |
Each rate keeps the date of its own latest published value; overnight market rates are published on the next business day.
Latest figure: 2026-11-12 Data last updated 2026-11-16 · current
Source: Banco Central do Brasil ODbL; Bank for International Settlements (BIS) Terms of permitted use of BIS statistics; Federal Reserve Bank of New York New York Fed Terms of Use; Board of Governors of the Federal Reserve System Public domain (U.S. government work); European Central Bank ECB reuse policy; Sveriges Riksbank Riksbank open data terms; The World Bank Group CC BY 4.0; Reserve Bank of Australia 2026 RBA copyright terms (Cash Rate); Bank of Canada Bank of Canada terms of use; Bank of England Open Government Licence v3.0
The one-year change is computed by CalculatorLib from these data. The EFFR and SOFR are subject to the Terms of Use posted at newyorkfed.org. The New York Fed is not responsible for publication of the EFFR and SOFR by CalculatorLib, does not sanction or endorse any particular republication, and has no liability for your use.
Source details and methodology
- Banco Central do Brasil
- Bank for International Settlements (BIS) — Central bank policy rates
- Federal Reserve Bank of New York — Reference rates (EFFR, SOFR)
- Board of Governors of the Federal Reserve System
- European Central Bank
- Sveriges Riksbank
- The World Bank Group — World Development Indicators (FR.INR.LEND, FR.INR.RINR)
- Reserve Bank of Australia 2026
- Bank of Canada
- Bank of England
FAQ
What yield should I use? A conservative 3–4% is common for diversified portfolios; dividend or bond yields may differ. Use a rate you can sustain.
Does this account for inflation or taxes? No. It is a gross, pre-tax estimate. Reduce your effective yield to allow for taxes and inflation.
Is this the 4% rule? Using a 4% yield gives the same answer as the 4% rule — you need 25 times your target annual income.