What is the SMOG / Air Quality Index (AQI) Calculator?
This calculator converts a measured air-pollutant concentration into the U.S. EPA Air Quality Index (AQI), a 0–500 scale used to communicate how clean or polluted the air is and the associated health concern. It supports PM2.5 (24-hour), PM10 (24-hour) and ground-level Ozone (8-hour). The rules and breakpoint tables used here follow the U.S. EPA standard.
How to use it
Pick the pollutant, enter the measured concentration in the indicated units (µg/m³ for particulates, ppb for ozone), and read off the AQI value and its health category. The tool truncates your concentration to the EPA convention (one decimal for PM2.5, whole number for PM10 and ozone) before applying the formula.
The formula explained
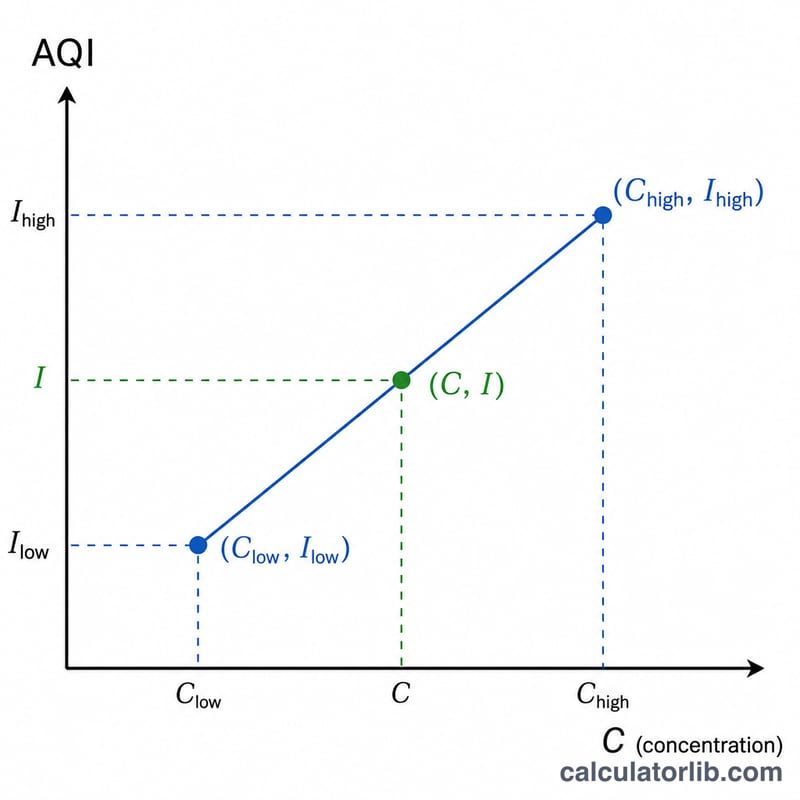
The EPA uses a piecewise linear interpolation between published breakpoints:
$$\text{AQI} = \frac{I_{hi} - I_{lo}}{C_{hi} - C_{lo}}\left(\text{C} - C_{lo}\right) + I_{lo}$$
where \(C\) is the truncated concentration, \(C_{lo}\)/\(C_{hi}\) are the breakpoint concentrations that bracket \(C\), and \(I_{lo}\)/\(I_{hi}\) are the corresponding AQI breakpoints. The result is rounded to the nearest whole number.
Worked example
Ozone = 60 ppb (8-hr). Truncated to 60. It falls in the 55–70 ppb band where \(I_{lo} = 51\), \(I_{hi} = 100\). $$\text{AQI} = \frac{100 - 51}{70 - 55} \times (60 - 55) + 51 = \frac{49}{15} \times 5 + 51 = 16.333\ldots + 51 = 67.333\ldots$$ which rounds to 67. Category: Moderate.
FAQ
Why does the AQI use breakpoints? Health effects are not perfectly linear with concentration, so the EPA defines straight-line segments between key thresholds to map concentration to a single intuitive index.
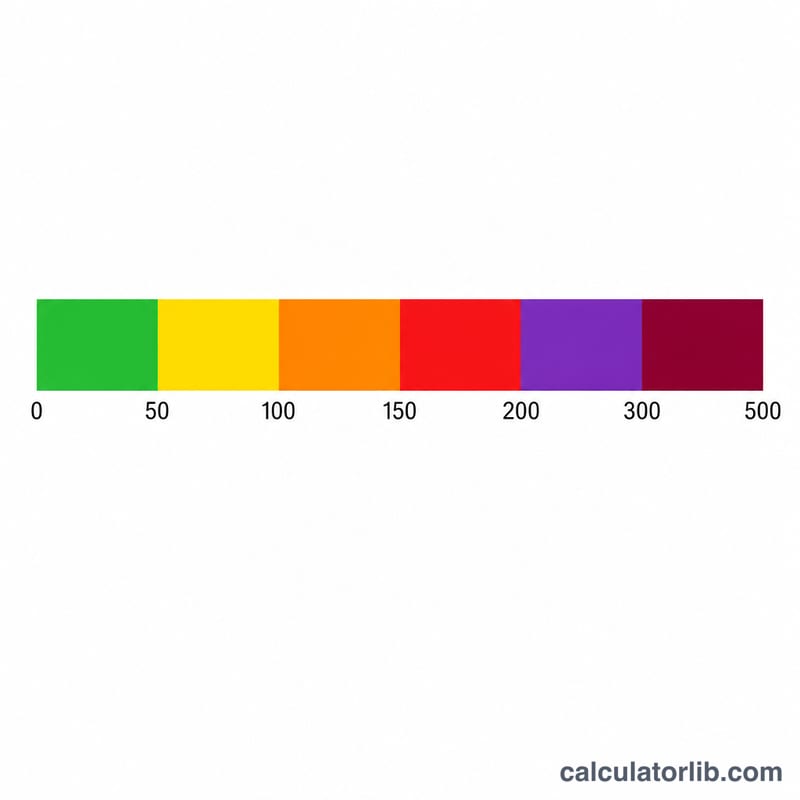
What do the categories mean? 0–50 Good, 51–100 Moderate, 101–150 Unhealthy for Sensitive Groups, 151–200 Unhealthy, 201–300 Very Unhealthy, 301+ Hazardous.
Why truncate the concentration? EPA guidance requires truncating (not rounding) the input concentration to a set number of decimals before applying the formula, ensuring consistent, reproducible AQI values.