What Is a Points-Based Grade Calculator?
Many courses use a total points system rather than weighted categories. In this system, every assignment, quiz, and exam is worth a fixed number of points, and your final grade is simply the total points you earned divided by the total points possible. This calculator does that division for you and converts the result into a percentage and a typical US letter grade.
How to Use It
Add up the points you have earned across every graded item and enter that in Total Points Earned. Then add up the maximum points all those items were worth and enter it in Total Points Possible. Click calculate to see your percentage and letter grade. You can also use it to project a target grade by experimenting with future points.
The Formula Explained
The math is straightforward:
$$\text{Grade \%} = \frac{\text{Sum of Points Earned}}{\text{Sum of Points Possible}} \times 100$$
Because every point counts equally, an assignment worth 200 points affects your grade twice as much as one worth 100 points — there are no separate category weights to track.
Worked Example
Suppose over the semester you earned 850 points out of a possible 1000. Your grade is $$(850 \div 1000) \times 100 = 85\%$$ which corresponds to a letter grade of B on a standard scale.
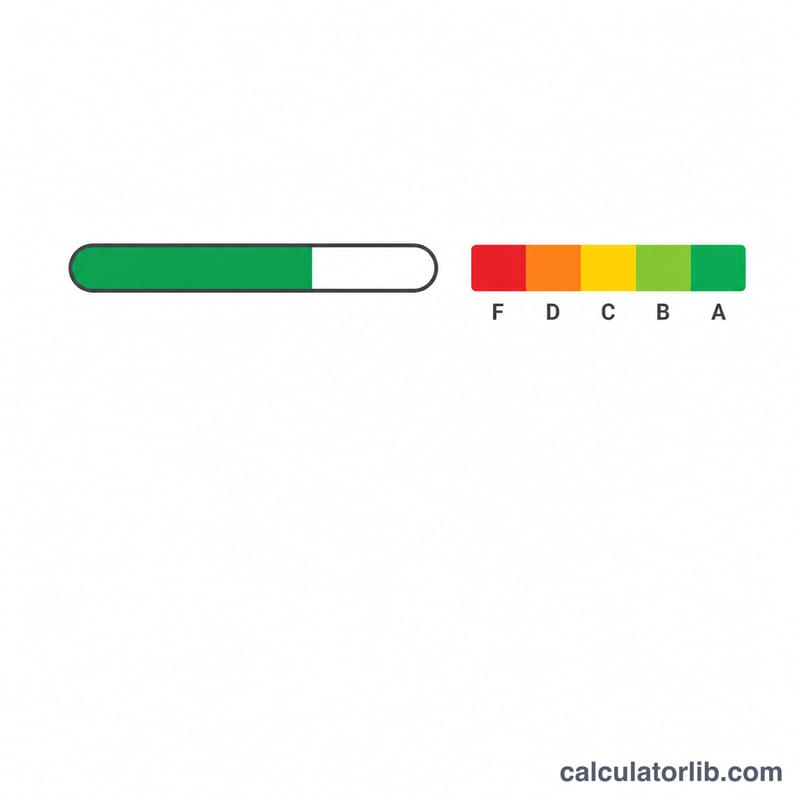
Letter Grade Scale Reference Table
Once the total points system gives you a percentage, that percentage has to be translated into a letter. The table below shows a plus/minus scale that is widely used in United States secondary schools and universities, together with the grade-point value each letter commonly carries on an unweighted 4.0 scale.
| Percentage range | Letter grade | Typical 4.0-scale GPA value |
|---|---|---|
| 97–100% | A+ | 4.0 |
| 93–96.9% | A | 4.0 |
| 90–92.9% | A− | 3.7 |
| 87–89.9% | B+ | 3.3 |
| 83–86.9% | B | 3.0 |
| 80–82.9% | B− | 2.7 |
| 77–79.9% | C+ | 2.3 |
| 73–76.9% | C | 2.0 |
| 70–72.9% | C− | 1.7 |
| 67–69.9% | D+ | 1.3 |
| 63–66.9% | D | 1.0 |
| 60–62.9% | D− | 0.7 |
| Below 60% | F | 0.0 |
Important caveats
- This is a convention, not a rule. The ranges above are a common North American pattern, but they are not defined by any standards body and they are not universal. Grading scales in other countries differ completely — many use numeric marks (for example 1–5, 0–20 or 0–100 with different pass thresholds) rather than letters at all.
- Many schools use the simpler straight scale. On the 90/80/70/60 scale, 90–100% is an A, 80–89.9% a B, 70–79.9% a C, 60–69.9% a D and anything below 60% an F, with no pluses or minuses. The scenario table and FAQ on this page use that straight scale as the default.
- Plus/minus may not be awarded at all. Some institutions record only whole letters on the transcript; others award A− through D+ but deliberately omit A+ or treat it as 4.0 rather than 4.3. Whether an A+ is worth 4.0 or 4.3 is a local policy decision.
- The official syllabus or registrar scale always governs. If your course syllabus lists cut-offs that differ from this table — a 94% A line, a 65% pass line, a curve applied after the fact — the syllabus wins. Use the table only as a sanity check.
- Rounding is a human decision, not arithmetic. The division itself gives an exact number; whether 89.5% is rounded up to an A− (or to an A on the straight scale) is set by your instructor. Some round to the nearest whole percent, some truncate, and some hold the published cut-off strictly, so 89.99% stays a B+. Ask before assuming.
Points Scenarios Compared
Every row below uses the same calculation, \(\text{Grade \%} = \dfrac{\text{Points Earned}}{\text{Points Possible}} \times 100\). What changes is which assignments are counted in the denominator — and as the fourth and fifth rows show, that single choice can move a grade by nine percentage points. Letters are shown on both the simple 90/80/70/60 straight scale and the plus/minus scale from the table above; United States conventions, and your syllabus may set different cut-offs.
| Scenario | Points earned | Points possible | Percentage | Letter (straight scale) | Letter (plus/minus scale) |
|---|---|---|---|---|---|
| Mid-semester check, small course | 430 | 500 | 86.0% | B | B |
| Mid-semester check, mid-size course | 612 | 700 | 87.4% | B | B+ |
| End of semester, all work graded | 850 | 1000 | 85.0% | B | B |
| Final project ungraded, excluded from the denominator | 850 | 900 | 94.4% | A | A |
| Same 100-point project counted as a zero | 850 | 1000 | 85.0% | B | B |
| Near-threshold case (one point from a higher letter) | 268 | 300 | 89.3% | B | B+ |
| 30 extra-credit points on a 1000-point course | 1030 | 1000 | 103.0% | A | A |
Graded-so-far versus counted-as-zero
Rows four and five contain exactly the same 850 earned points. The only difference is the denominator: 900 points (the work that has actually been graded) versus 1000 points (the whole course, with the unsubmitted 100-point project scored as zero). That is the gap between 94.4% and 85.0% — an A against a B. Use 900 when you want to know how you are performing on completed work, and 1000 when you want the worst case if you submit nothing else. Most learning-management systems show the first by default, which is why an end-of-term grade so often drops.
Near-threshold rows deserve a second look
The 268/300 row sits 0.7 points below a 90% A line: 90% of 300 is 270 points, so two more points would change the letter. At small point totals a single quiz question carries real weight, and this is exactly where your instructor's rounding policy — not the arithmetic — decides the outcome.
How many points do you still need?
Rearranging the same formula for a target grade gives:
$$\text{Points still needed} = \left(\frac{\text{Target \%}}{100} \times \text{Total points possible}\right) - \text{Points already earned}$$Worked once with the numbers from row three, aiming for 90% of a 1000-point course with 850 points already banked and 100 points left on the table:
$$\text{Points still needed} = \left(\frac{90}{100} \times 1000\right) - 850 = 900 - 850 = 50$$So you need 50 of the remaining 100 points — a 50% score on the final project — to finish at exactly 900/1000, or 90.0%. If the answer ever comes out larger than the points remaining, the target is mathematically out of reach without extra credit; if it comes out negative, you have already locked in that grade.
FAQ
How is this different from a weighted grade calculator? A weighted calculator multiplies each category by a percentage weight. The total points system gives weight automatically through point values, so you only need two totals.
What letter grade scale is used? This tool uses a common scale: 90+ = A, 80–89 = B, 70–79 = C, 60–69 = D, below 60 = F. Your school's scale may differ.
Can I include extra credit? Yes. Add extra-credit points to your earned total without increasing the points-possible total to see the boost.