What is the YKS Ranking Calculator?
Turkey's YKS (Yükseköğretim Kurumları Sınavı) is the national university entrance exam, and placement depends far more on your national ranking than on your raw score. This calculator estimates where a given score falls among all test-takers by modeling the score distribution as a normal (bell) curve and converting your score into a percentile and an approximate rank.
How to use it
Enter your YKS score, the average (mean) score of all candidates, the standard deviation of scores, and the total number of candidates. The tool returns your estimated national rank, your percentile (the percentage of candidates you scored above), and your z-score.
The formula explained
First the score is standardized with the z-score, where \(x\) = your score, \(\mu\) = mean score and \(\sigma\) = standard deviation:
$$z = \frac{x - \mu}{\sigma}$$The cumulative normal distribution \(\Phi(z)\) gives the fraction of candidates scoring below you, so the fraction scoring higher is \(1 - \Phi(z)\). Multiplying by the total candidate count \(N\) gives the estimated rank:
$$\text{Rank} = (1 - \Phi(z)) \times N$$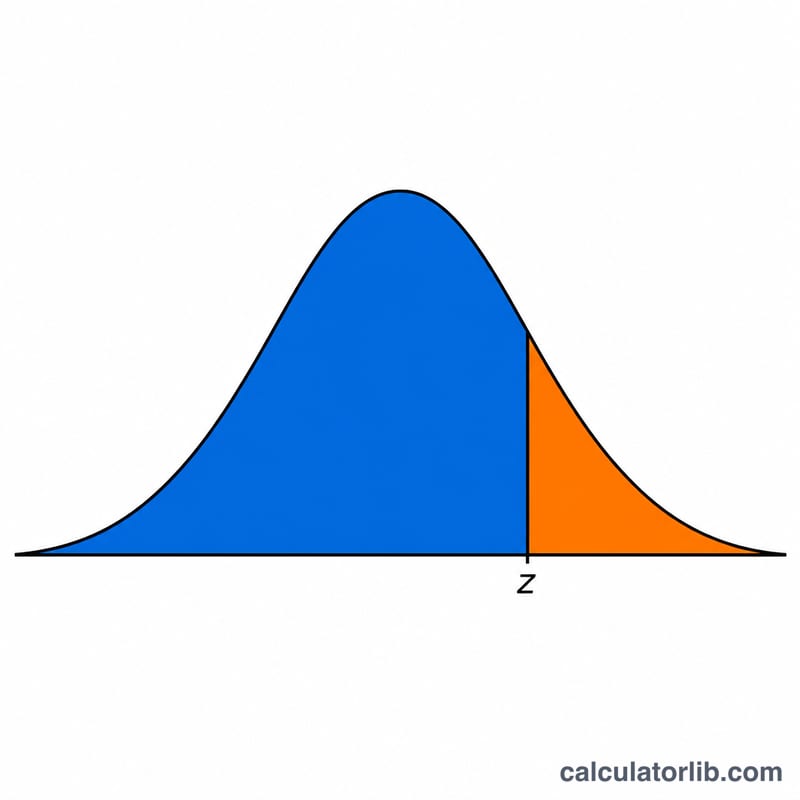
Worked example
Suppose your score is 350, the mean is 250, the standard deviation is 50, and there are 3,000,000 candidates. The z-score is:
$$z = \frac{350 - 250}{50} = 2$$The normal CDF gives \(\Phi(2) \approx 0.9772\), so you scored above about 97.72% of candidates and the rank is:
$$\text{Rank} = (1 - 0.9772) \times 3{,}000{,}000 \approx 68{,}250$$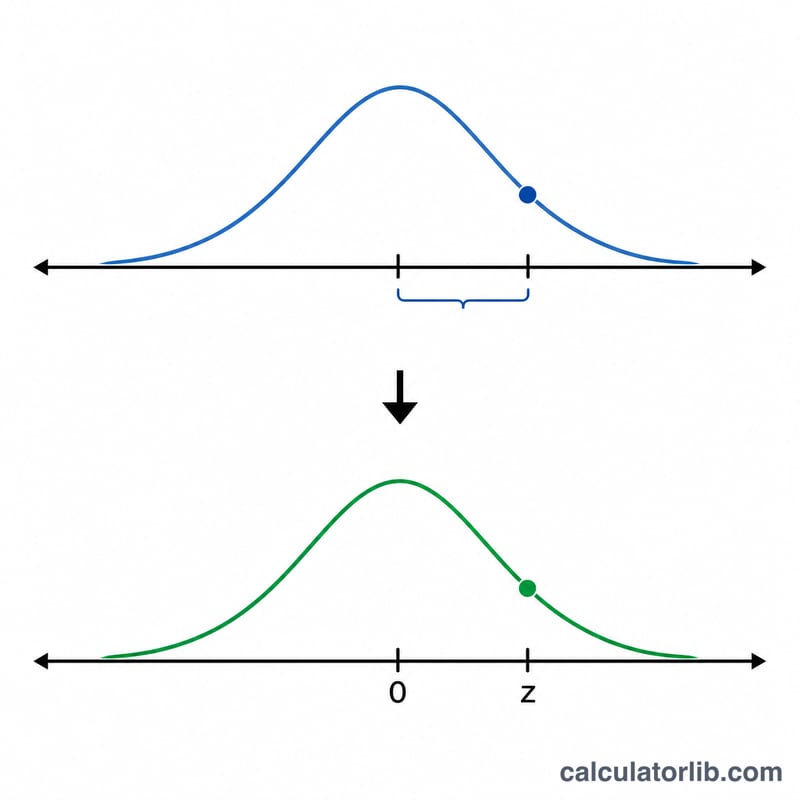
Z-Score to Percentile and Rank Reference Table
The calculator turns your score into a z-score, \(z = \dfrac{\text{Score} - \text{Mean}}{\text{Std. Dev.}}\). It then uses the standard normal cumulative distribution function \(\Phi(z)\) to estimate two things. Your percentile is \(P = \Phi(z) \times 100\). Your rank is the number of candidates expected to score above you, \(R = (1 - \Phi(z)) \times N\).
The table below uses N = 3,000,000 candidates. This is an illustrative example value only, not an official ÖSYM figure. Real candidate counts differ by year and by score type, so enter the count that applies to you.
| z-score | Φ(z) | Percentile | Fraction scoring higher (1 − Φ(z)) | Estimated rank (example N = 3,000,000) |
|---|---|---|---|---|
| −1.0 | 0.1587 | 15.87% | 0.8413 | ≈ 2,524,000 |
| 0.0 | 0.5000 | 50.00% | 0.5000 | 1,500,000 |
| 0.5 | 0.6915 | 69.15% | 0.3085 | ≈ 925,600 |
| 1.0 | 0.8413 | 84.13% | 0.1587 | ≈ 476,000 |
| 1.5 | 0.9332 | 93.32% | 0.0668 | ≈ 200,400 |
| 2.0 | 0.9772 | 97.72% | 0.0228 | 68,250 |
| 2.5 | 0.9938 | 99.38% | 0.0062 | ≈ 18,630 |
| 3.0 | 0.99865 | 99.865% | 0.00135 | ≈ 4,050 |
The calculator computes Φ(z) at full precision. That is why the ranks shown differ slightly from multiplying N by the rounded four-decimal values. For example, at z = 2: $$R = (1 - 0.97725) \times 3{,}000{,}000 \approx 68{,}250$$ You get this with a score of 400, a mean of 300 and a standard deviation of 50, because \(z = (400 - 300)/50 = 2\).
Interpreting Your Estimated Rank
Percentile and rank are two different measures. Your percentile is the share of candidates expected to score at or below you. A percentile of 97.72 means about 97.72% of the group scored no higher than you. Your rank is a count of people: about how many candidates are expected to score above you. In this calculator, rank 1 is the top position, so a smaller number is better. Percentile ignores the size of the group. Rank grows in direct proportion to the number of candidates you enter.
Your inputs drive the result. The estimate depends entirely on the mean, standard deviation and candidate count you enter. Change the mean or standard deviation slightly and the z-score shifts, which can move the estimated rank by tens of thousands of places in the middle of the distribution. Changing the candidate count scales the rank up or down in the same proportion. Use figures for the same exam year and the same score type as your own score.
The bell-curve model is only an approximation. The calculator assumes scores follow a normal (bell-shaped) distribution. Real YKS scores do not fit that shape exactly:
- ÖSYM scores have fixed limits, running roughly from 100 to 500. A normal curve has no limits.
- Real score distributions are usually skewed rather than symmetric, and many candidates cluster at certain levels.
- ÖSYM publishes scores and rankings separately for TYT and for the SAY, EA, SÖZ and DİL score types. Each has its own number of candidates and its own spread, so you cannot combine them or swap one for another.
For these reasons, the estimate is most reliable near the middle of the distribution, roughly between z = −1 and z = 1. It is least reliable in the tails, at very high or very low z-scores. There, small differences between the model and the real distribution can change the estimated rank by a large proportion.
The estimate is not your official result. University placement in Turkey uses ÖSYM's official success rankings and the base rankings (taban sıralamaları) published for each program. It does not use this estimate. Treat the calculator's output as a rough statistical approximation, and check your official ÖSYM results for any decision.
FAQ
Is this an official ranking? No. It is a statistical estimate based on a normal-distribution model; official rankings come from ÖSYM after the exam.
Where do I get the mean and standard deviation? ÖSYM publishes statistics each year; you can also use published estimates for TYT or AYT sections.
Why use a normal distribution? Large exam populations tend to follow a bell-shaped curve, making it a reasonable and simple approximation for percentile and rank.