What is the 9-Point Flatness Calculator?
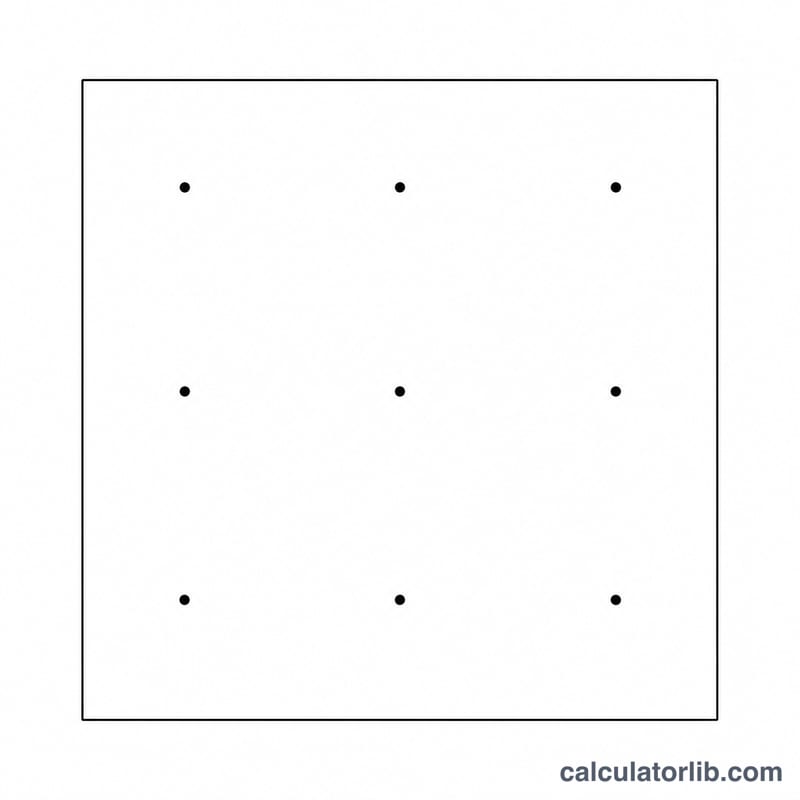
The 9-Point Flatness Calculator estimates the flatness deviation of a machined or ground surface using nine height readings taken across the part. In machining quality control, inspectors commonly probe a surface on a 3×3 grid and record how far each point rises or falls relative to a reference. The largest peak-to-valley difference is a simple, practical indicator of how flat the surface really is.
The formula explained
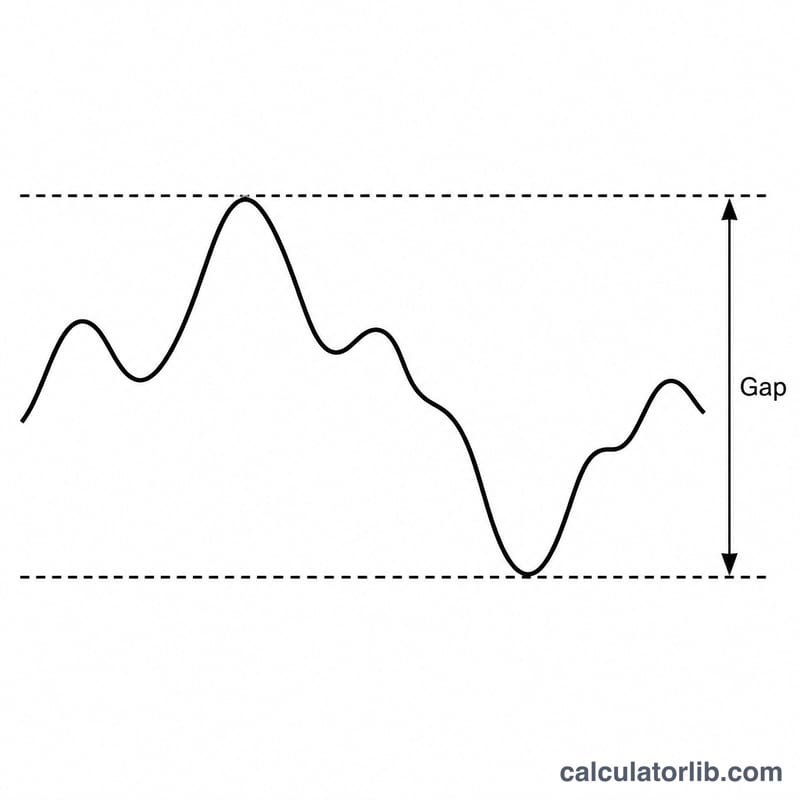
Flatness deviation is the range of the measured heights: the maximum reading minus the minimum reading.
$$\text{Flatness} = h_{max} - h_{min}$$
Here \(h_{max}\) is the highest measured point, \(h_{min}\) is the lowest, and each \(h_i\) is one of the nine readings in millimetres. The calculator also reports the mean height:
$$\bar{h} = \frac{1}{9}\sum_{i=1}^{9} h_i$$
How to use it
Measure nine points across the surface in a consistent grid pattern and enter each value in millimetres. Use the same datum for every reading so the numbers are comparable. The tool returns the flatness deviation, the maximum and minimum heights, and the mean.
Worked example
Suppose the nine readings are 10, 12, 11, 9, 13, 10, 8, 14 and 11 mm. The maximum is \(14\) mm and the minimum is \(8\) mm, so:
$$\text{Flatness} = 14 - 8 = 6\,\text{mm}$$
The mean is \(\bar{h} = \tfrac{98}{9} \approx 10.89\,\text{mm}\).
Typical Flatness Tolerances by Process and Standard
Flatness is normally specified in millimetres (mm) or micrometres (µm) as a single peak-to-valley limit. The figures below fall into two groups: general tolerances from the international standard ISO 2768-2 (which apply when a drawing invokes it but gives no individual flatness callout), and typical achievable flatness by machining process, which are general shop-practice ranges rather than fixed standard values.
ISO 2768-2 general flatness tolerances (mm)
Under ISO 2768-2, the permitted flatness depends on the longer side of the surface (nominal length range) and the chosen tolerance class H, K, or L. These are the standard's tabulated values.
| Nominal length range (mm) | Class H (mm) | Class K (mm) | Class L (mm) |
|---|---|---|---|
| up to 10 | 0.02 | 0.05 | 0.1 |
| over 10 up to 30 | 0.05 | 0.1 | 0.2 |
| over 30 up to 100 | 0.1 | 0.2 | 0.4 |
| over 100 up to 300 | 0.2 | 0.4 | 0.8 |
| over 300 up to 1000 | 0.3 | 0.6 | 1.2 |
| over 1000 up to 3000 | 0.4 | 0.8 | 1.6 |
Source: ISO 2768-2 (general geometrical tolerances). Class H is the finest, L the coarsest. This is an international standard; a drawing must reference it for these values to apply.
Typical achievable flatness by process
The ranges below are widely quoted general engineering references for what each process can typically hold on a rigid part; they are not drawn from a single published standard, and actual results vary with material, size, fixturing, and machine condition.
| Process | Typical achievable flatness (mm) |
|---|---|
| Lapping / precision hand-scraping | ≈ 0.0005 – 0.005 |
| Surface grinding | ≈ 0.005 – 0.02 |
| Precision (fine) milling | ≈ 0.02 – 0.05 |
| General / rough milling | ≈ 0.1 – 0.3 and above |
These process figures are general shop-practice guidance, not a formal standard. When a drawing states a flatness tolerance, that callout governs — compare your measured peak-to-valley value against it, not against these typical ranges.
Interpreting Your Flatness Result
This calculator reports the peak-to-valley flatness — the difference between the highest and lowest of your nine height readings:
$$\text{Flatness} = \max(\text{P1}, \dots, \text{P9}) - \min(\text{P1}, \dots, \text{P9})$$In GD&T terms (defined internationally in ISO 1101 and, in the United States, in ASME Y14.5), a flatness callout defines a tolerance zone bounded by two parallel planes a distance t apart, where t is the specified flatness value. The whole surface must lie between those two planes. Your peak-to-valley result is a direct estimate of the actual separation the surface would need, so you compare it to the drawing's flatness value t:
- Result ≤ tolerance: the measured points fit within the zone — the surface passes for those points.
- Result > tolerance: the measured points exceed the zone — the surface fails.
For example, nine readings with a maximum of 0.09 mm and a minimum of 0.02 mm give a peak-to-valley flatness of 0.07 mm. That would pass a 0.1 mm tolerance and fail a 0.05 mm tolerance.
Important limitation: nine grid points approximate the surface; they do not fully capture true flatness. Deviations located between the measured points — local bumps, dips, edge roll-off, or waviness at a finer spacing — are not seen. A true GD&T flatness verification considers the entire surface (for example, a dense point cloud from a CMM or optical scanner), so a passing 9-point result indicates conformance at those points only, not a guarantee for the complete surface.
FAQ
Is a lower flatness value better? Yes. A smaller deviation means the surface is closer to a true plane.
Does the reference datum matter? Adding a constant offset to every point does not change the flatness deviation, because it shifts both the max and the min equally.
What units should I use? Any consistent unit works; results are in the same unit you enter, typically millimetres.