What Is Stolen Base Success Rate?
Stolen base success rate (often written SB%) measures how often a base runner succeeds when attempting to steal a base in baseball or softball. It is a universal statistic with no regional differences: simply divide successful steals by total steal attempts. A high success rate shows a runner is helping the team more than the outs they cost on caught-stealing attempts.

How to Use This Calculator
Enter the number of Stolen Bases (SB) — successful steals — and the number of times the runner was Caught Stealing (CS). The calculator adds them to find total attempts, divides SB by attempts, and returns the rate as a three-decimal figure (baseball convention, e.g. .800) plus an equivalent percentage.
The Formula Explained
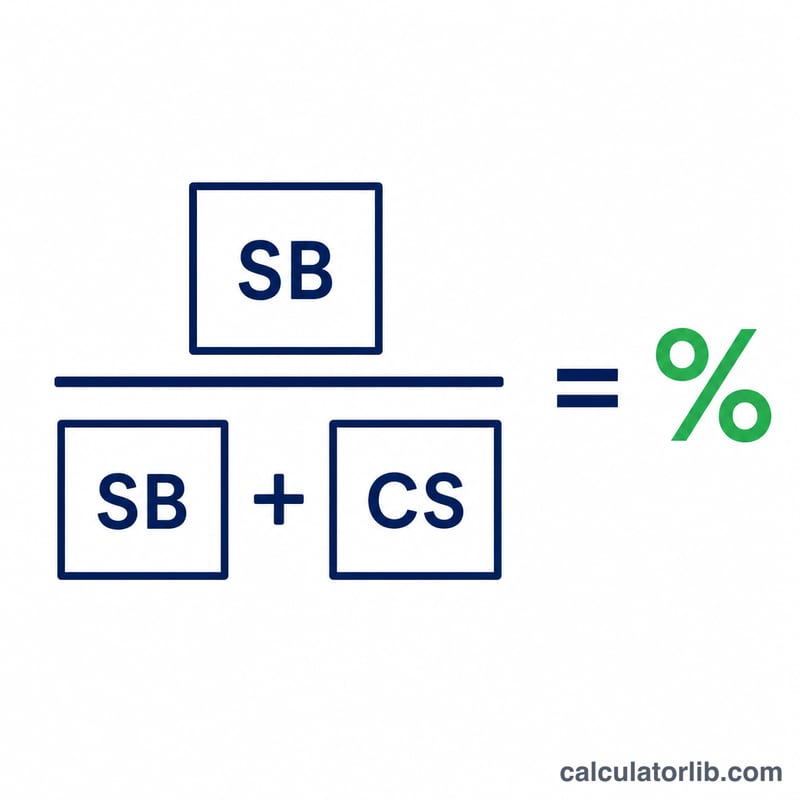
The core equation is:
$$\text{SB\%} = \frac{\text{SB}}{\text{SB} + \text{CS}} \times 100\%$$
The denominator, \(\text{SB} + \text{CS}\), is the total number of steal attempts. The result always falls between 0 (every attempt caught) and 1 (every attempt successful). It is rounded to three decimal places. If there are no attempts at all (\(\text{SB} + \text{CS} = 0\)), the rate is undefined and the calculator returns 0.
Worked Example
Suppose a player has 40 stolen bases and 10 times caught stealing. Total attempts = \(40 + 10 = 50\). The success rate is \(40 / 50 = 0.800\), or 80.0%. Another runner with 27 SB and 8 CS has 35 attempts, giving \(27 / 35 = 0.771\) (77.1%).
Interpreting Your SB% Result
Stolen base success rate (SB%) tells you what share of a runner's steal attempts succeeded. It is expressed both as a decimal (for example, .800) and a percentage (80%). The formula is simply stolen bases divided by total attempts: \[ \text{SB\%} = \frac{\text{SB}}{\text{SB} + \text{CS}} \times 100\% \]
The ~70-75% Break-Even Point
The most important benchmark in interpreting SB% comes from run expectancy, the sabermetric framework that measures how many runs a team can expect to score given the bases occupied and number of outs. A successful steal advances a runner and slightly raises run expectancy, but a caught stealing erases a baserunner and burns an out, which is far more costly. Because the penalty for being thrown out is larger than the reward for succeeding, a runner generally needs to succeed roughly 70-75% of the time just to break even — that is, to add no net value but also subtract none.
As a concrete reference, a runner with 35 steals and 12 caught stealing has a success rate of 74.5%, sitting right at the edge of that break-even band.
Above vs. Below the Threshold
- Above ~75%: The runner is adding net value. Each successful steal more than pays for the occasional time caught, so the aggressive baserunning is helping the team score.
- Around 70-75%: The runner is roughly neutral — the steals are essentially a wash in terms of run expectancy.
- Below ~70%: The runner is likely costing the team runs. Outs on the bases are expensive, and a low success rate means too many drives are stalling because a runner was thrown out.
Why Sample Size Matters
A success rate is only as meaningful as the number of attempts behind it. With very few attempts, the rate is noisy — it can swing wildly on a single outcome and tells you little about true skill. Consider two runners:
- 1.000 on 2 attempts (2 SB, 0 CS): a perfect rate, but on just two tries it is essentially meaningless. One caught stealing would drop the same runner to .667.
- .800 on 50 attempts (40 SB, 10 CS): a slightly lower rate, but built on a large body of evidence — this is a genuinely elite, reliable basestealer well above the break-even point.
In short, weigh the volume of attempts alongside the percentage. A high rate on a handful of tries should be treated with caution, while a strong rate sustained over many attempts is a much firmer indicator of value. This is general informational guidance for understanding the statistic, not coaching or strategic advice for a specific player or game situation.
FAQ
What is a good stolen base success rate? Analysts commonly cite roughly 70-75% (about .700-.750) as the break-even point where the runs gained outweigh the cost of outs; higher is better.
Does this work for softball too? Yes. The statistic is defined the same way in softball and any sport that tracks stolen bases and caught stealing.
Why round to three decimals? Baseball traditionally displays rates to three decimal places (the fourth is rounded off), the same convention used for batting average.


