
What this calculator does
This tool computes three classic price indices for a basket of goods: the Laspeyres index, the Paasche index and the Fisher index. Each measures how the overall price level of the basket has changed between a base period (t0) and a comparison period (tn), with the base period set to 100 by convention. These definitions are universal in economics and statistics and are not specific to any country, though national statistics offices around the world rely on them to build consumer price indices.
How to use it
For every good in your basket, fill one row with four numbers: the base-period price, the base-period quantity, the comparison-period price and the comparison-period quantity. Leave unused rows blank. The calculator sums the price-times-quantity products across all goods and returns all three indices instantly.
The formulas explained
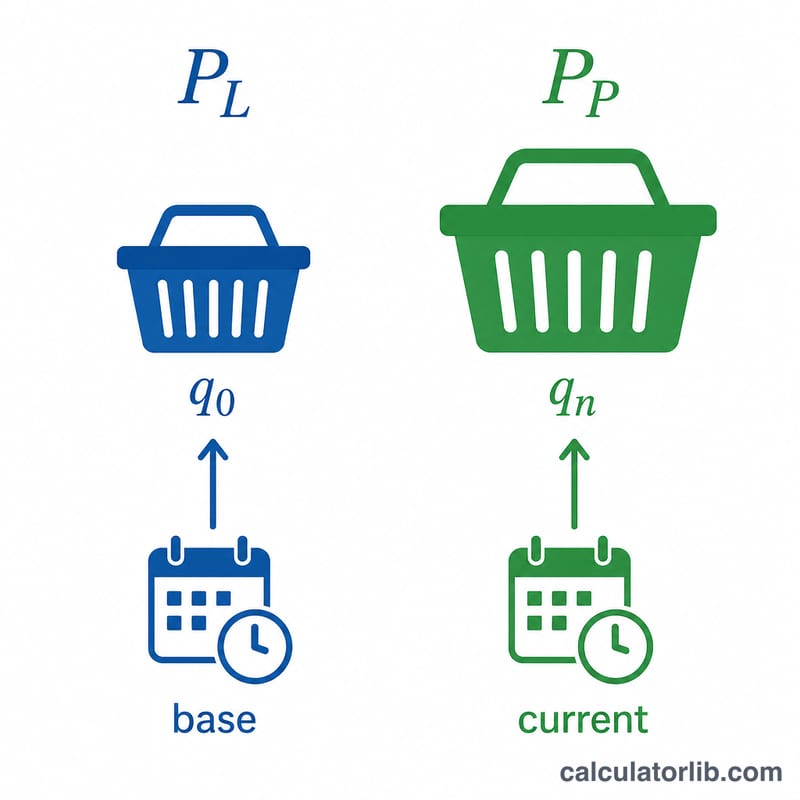
The Laspeyres index weights price changes by base-period quantities: it asks how much the base-period basket would cost at new prices.
$$L = \frac{\sum p_t \cdot q_0}{\sum p_0 \cdot q_0} \times 100$$The Paasche index weights by comparison-period quantities, reflecting the basket actually bought today.
$$P = \frac{\sum p_t \cdot q_t}{\sum p_0 \cdot q_t} \times 100$$Because consumers substitute away from goods that become relatively expensive, Paasche typically falls below Laspeyres. The Fisher "ideal" index is the geometric mean of the two and corrects for this bias, always lying between them.
$$F = \sqrt{L \times P}$$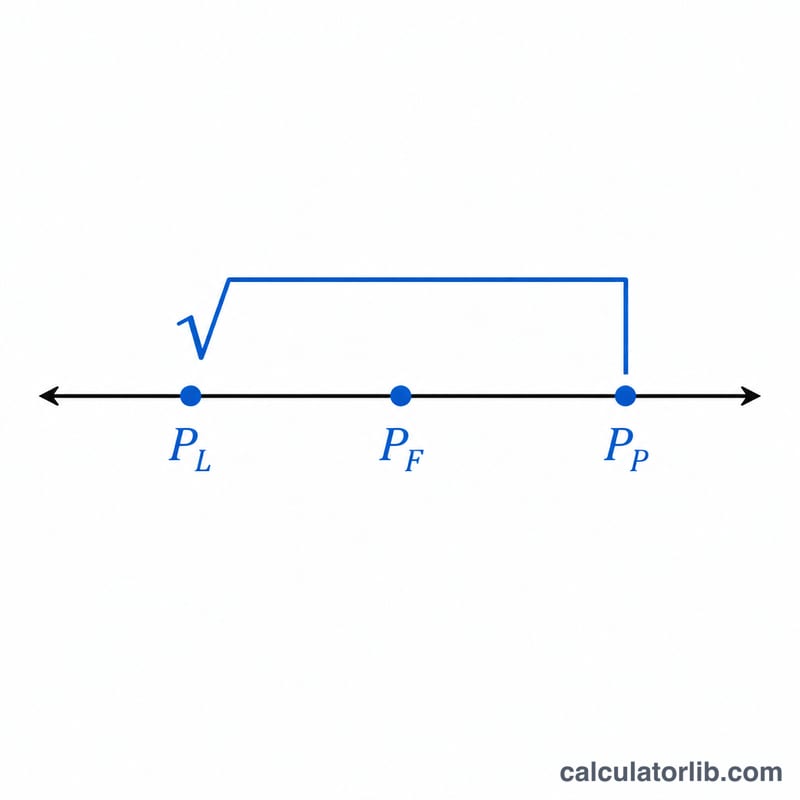
Worked example
Good 1: base price 100, base qty 10, comp price 200, comp qty 5. Good 2: base price 100, base qty 10, comp price 100, comp qty 15.
$$L = \frac{200 \times 10 + 100 \times 10}{100 \times 10 + 100 \times 10} \times 100 = \frac{3000}{2000} \times 100 = 150$$$$P = \frac{200 \times 5 + 100 \times 15}{100 \times 5 + 100 \times 15} \times 100 = \frac{2500}{2000} \times 100 = 125$$$$F = \sqrt{150 \times 125} \approx 136.93$$FAQ
Why do Laspeyres and Paasche differ? They use different quantity weights. Laspeyres uses old quantities, Paasche uses new ones; the gap reflects the substitution effect.
Which index is best? Fisher is often called the "ideal" index because it satisfies key consistency tests and averages out the upward bias of Laspeyres and downward bias of Paasche.
What if base expenditure is zero? An index is undefined when its denominator (total base-period spending on the weighted basket) is zero, so enter at least one good with a positive base price and quantity.


