What the Strikeout Rate Calculator Does
This calculator is built around American baseball pitching statistics. It takes four simple inputs from a pitcher's stat line and turns them into four standard analytics metrics used across MLB and amateur baseball: strikeout rate (K/9), walk rate, the strikeout-to-walk ratio (K/BB), and WHIP. Enter the numbers and you instantly see how effectively a pitcher misses bats and limits baserunners.
The Inputs You Provide
- Strikeouts – total batters the pitcher struck out.
- Innings Pitched – innings recorded (decimals allowed, e.g. 6.0).
- Batters Hit – batters hit by pitch (counted as baserunners here).
- Walks – bases on balls issued.
The Formulas Used
The calculator only computes per-nine-inning rates and WHIP when innings pitched is greater than zero:
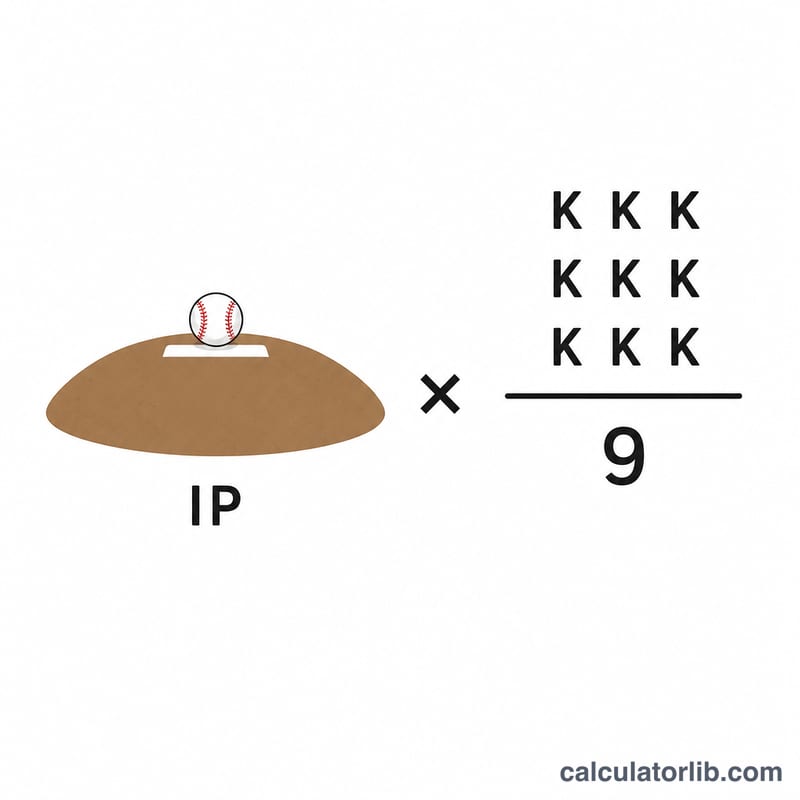
- Strikeout Rate (K/9) = \(\frac{\text{Strikeouts}}{\text{Innings Pitched}} \times 9\)
- Walk Rate = \(\frac{\text{Walks} + \text{Batters Hit}}{\text{Innings Pitched}} \times 9\)
- WHIP = \(\frac{\text{Walks} + \text{Batters Hit}}{\text{Innings Pitched}}\)
- K/BB Ratio = \(\frac{\text{Strikeouts}}{\text{Walks} + \text{Batters Hit}}\), calculated only when there is at least one walk or hit batter
Note that this tool treats walks and hit batters together as the "free baserunners" component, so hits allowed are not part of its WHIP figure.
Worked Example
Suppose a pitcher throws 6 innings with 8 strikeouts, 2 walks, and 1 batter hit:
- K/9 = $$\left(\frac{8}{6}\right) \times 9 = \mathbf{12.0}$$
- Walk Rate = $$\left(\frac{2 + 1}{6}\right) \times 9 = \mathbf{4.5}$$
- WHIP component = $$\frac{2 + 1}{6} = \mathbf{0.50}$$
- K/BB = $$\frac{8}{2 + 1} = \mathbf{2.67}$$
A K/9 of 12 is excellent, showing this pitcher is dominating hitters.
K/9, BB/9 and K/BB Benchmarks
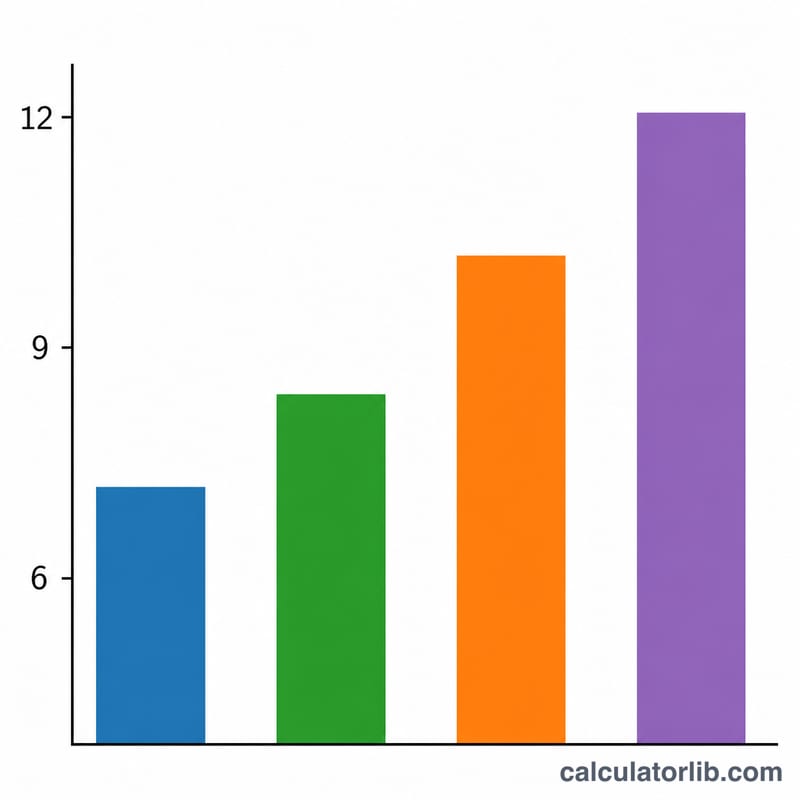
The tiers below are rough guides for Major League Baseball (MLB) pitchers. They reflect recent seasons, when the league-wide K/9 has been about 8.5–9. League norms change from year to year. Relievers usually post a higher K/9 than starters, so compare a pitcher with others in the same role and season when you can.
| Tier | K/9 (strikeouts per 9 IP) | BB/9 (walks per 9 IP) | K/BB (strikeouts per walk) |
|---|---|---|---|
| Poor | 6.0 or less | Over 4.0 | Under 1.75 |
| Below average | 6.5–7.9 | 3.5–4.0 | 1.75–2.4 |
| Average | 8.0–9.4 | About 3.0–3.3 | About 2.5–3.0 |
| Good | 9.5–10.9 | 2.0–2.7 | 3.1–4.0 |
| Elite | 11.0 or more | Under 2.0 | Over 4.0 |
Example: a pitcher with 180 strikeouts in 180 innings has a K/9 of \(\frac{180}{180} \times 9 =\) 9.0, which sits at the top of the MLB average range. With 50 walks, his K/BB would be \(180 \div 50 = 3.6\), which is good.
Note on this tool: the calculator adds hit batters (HBP) to walks. Its walk-based figure measures all free passes, so it will read a little higher than the standard BB/9 on most stat sites, which counts walks only. Its strikeout-to-walk ratio will also read a little lower than the standard K/BB. Allow for this before you compare against the table.
These benchmarks apply to professional MLB play only. Youth, high-school, college and amateur norms are very different. Strikeout and walk rates depend on age, level, game length and the quality of the opposition. Compare young or amateur pitchers with others at the same level.
Innings Pitched Notation: Box-Score Decimals to True Innings
Box scores record innings pitched (IP) in thirds, because each out is one-third of an inning. The digit after the point is the number of extra outs, not a decimal fraction. So 6.2 IP means 6 innings plus 2 outs, which is 6⅔ innings. A figure like 6.3 never appears, because three outs complete the inning.
| Box-score notation | Meaning | True innings | Decimal to use in math | Total outs |
|---|---|---|---|---|
| X.0 | X full innings | X | X.000 | 3X |
| X.1 | X innings + 1 out | X⅓ | X.333 | 3X + 1 |
| X.2 | X innings + 2 outs | X⅔ | X.667 | 3X + 2 |
| 0.1 | 1 out | ⅓ | 0.333 | 1 |
| 5.1 | 5 innings + 1 out | 5⅓ | 5.333 | 16 |
| 6.2 | 6 innings + 2 outs | 6⅔ | 6.667 | 20 |
| 7.0 | 7 full innings | 7 | 7.000 | 21 |
Why it matters: suppose a pitcher strikes out 8 batters in 6.2 IP. Using the true innings figure of 6.667:
$$K/9 = \frac{8}{6.667} \times 9 = 10.8$$If you treat 6.2 as a plain decimal, the result is inflated:
$$K/9 = \frac{8}{6.2} \times 9 \approx 11.6$$That error of almost a full strikeout per nine innings comes only from reading the notation wrong. Before you enter innings into a rate formula, convert box-score values (.1 → .333, .2 → .667). You can also count total outs and divide by 3.
K% vs K/9 and Other Key Terms
- K% (strikeout percentage): strikeouts divided by total batters faced (BF), \(\text{K\%} = \frac{\text{K}}{\text{BF}} \times 100\). The MLB average has been about 22–23% in recent seasons.
- K/9 (strikeouts per nine innings): \(\frac{\text{K}}{\text{IP}} \times 9\). It estimates how many strikeouts a pitcher would record in a complete nine-inning game.
- Walk rate / BB/9: walks (bases on balls) per nine innings, \(\frac{\text{BB}}{\text{IP}} \times 9\). Walk rate can also mean BB% (walks divided by batters faced). Lower is better.
- HBP (hit by pitch): a batter hit by a pitch is awarded first base. Standard BB/9 does not count HBP, but this calculator adds hit batters to walks.
- K/BB (strikeout-to-walk ratio): strikeouts divided by walks. It is a simple measure of command and dominance. About 2.5–3 is average in MLB, and over 4 is elite.
- WHIP (walks plus hits per inning pitched): standard WHIP is \(\frac{\text{BB} + \text{H}}{\text{IP}}\). This tool's version leaves out hits and uses walks and hit batters only. It is not comparable to published WHIP figures, which include hits.
Why analysts often prefer K% to K/9: K/9 is tied to innings, and innings depend on how many outs the defense records. A pitcher who allows many baserunners faces more batters each inning, so he has more chances to strike people out, which can inflate K/9. K% measures strikeouts per batter faced, so it shows directly how often a pitcher ends a plate appearance with a strikeout. It is also easier to compare across pitchers, roles and run environments. K/9 is still widely quoted and easy to calculate from box-score data, which is why this calculator uses it.
Frequently Asked Questions
What is a good strikeout rate? In MLB, a K/9 around 9 is solid; above 11 is elite. Youth and amateur benchmarks are lower.
Why does the calculator combine walks and hit batters? Both put a runner on base without the batter earning it, so they are grouped to measure control and damage prevention.
What happens if I enter zero innings? The rate and WHIP results stay at zero, since dividing by zero innings is undefined.
Related calculators
- ERA Calculator — earned run average.
- Batting Average Calculator — AVG from hits & at-bats.
- WHIP Calculator — walks + hits per inning.
- Slugging Percentage Calculator — SLG.