
What is the Body Fat Percentage (BMI Method) Calculator?
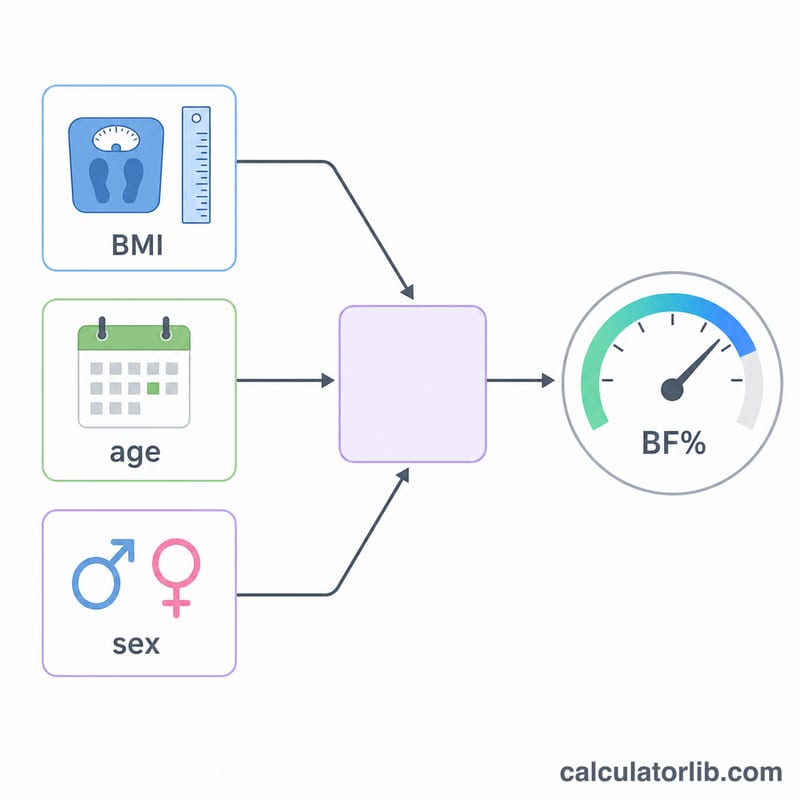
This calculator estimates your body fat percentage using the Deurenberg equation, which derives body fat from your Body Mass Index (BMI), age and sex. Unlike scales or skinfold measurements, it only needs your weight, height, age and sex, making it a quick population-level estimate. It applies to adults of any nationality and uses metric inputs (kg and cm).
How to use it
Select your sex, then enter your weight in kilograms, height in centimetres and your age in years. The calculator first computes your BMI, then plugs it into the Deurenberg formula to estimate body fat percentage, and finally splits your weight into estimated fat mass and lean (fat-free) mass.
The formula explained
BMI is calculated as weight (kg) divided by height (m) squared. The Deurenberg equation is: $$\text{BF\%} = 1.20 \times \text{BMI} + 0.23 \times \text{age} - 10.8 \times \text{sex} - 5.4$$ where sex is 1 for males and 0 for females. The age term reflects that body fat tends to rise with age at the same BMI, and the sex term reflects that women carry more essential fat than men at an equivalent BMI.
Worked example
A 30-year-old man weighing 75 kg at 178 cm has a height of 1.78 m, so $$\text{BMI} = 75 \div (1.78^2) = 75 \div 3.1684 \approx 23.67$$ Then $$\text{BF\%} = 1.20 \times 23.67 + 0.23 \times 30 - 10.8 \times 1 - 5.4 = 28.40 + 6.9 - 10.8 - 5.4 \approx 19.1\%$$ His fat mass is about 14.3 kg and lean mass about 60.7 kg.
Interpreting Your Body Fat Result
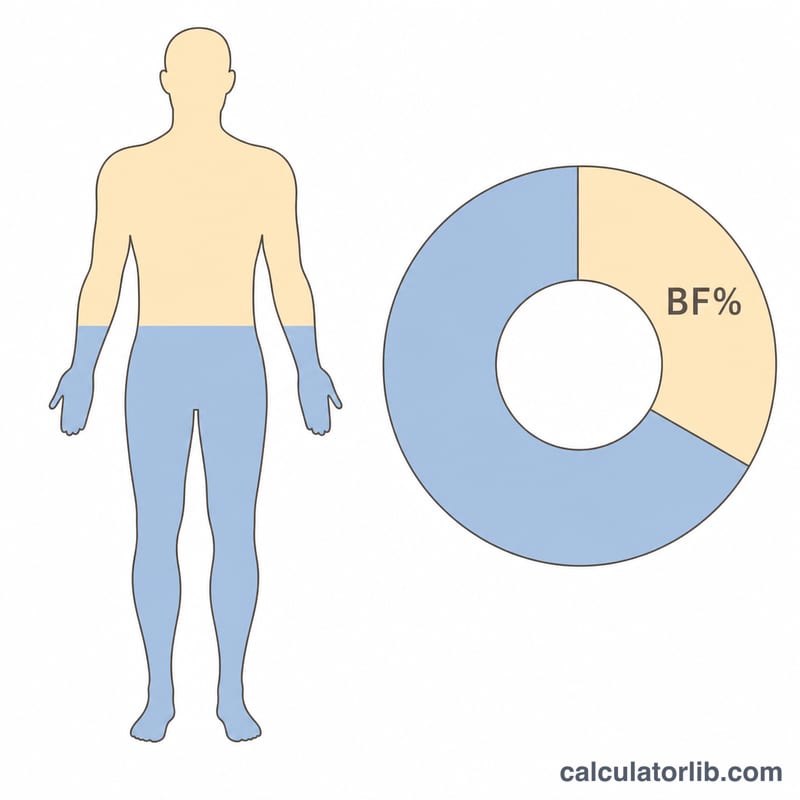
The number returned by the Deurenberg equation is an estimate of the share of your total body mass that is fat tissue. To judge whether a result is low, healthy or high, it is compared against population reference categories. The widely cited ranges published by the American Council on Exercise (ACE) are sex-specific:
| Category | Men | Women |
|---|---|---|
| Essential fat | 2–5% | 10–13% |
| Athletes | 6–13% | 14–20% |
| Fitness | 14–17% | 21–24% |
| Average / acceptable | 18–24% | 25–31% |
| Obese | 25%+ | 32%+ |
For example, a 30-year-old man with a BMI of 24 has an estimated body fat of 19.4%, which falls in the average/acceptable band for men.
It is an estimate, not a measurement
The Deurenberg formula predicts body fat from BMI, age and sex using regression data from a general adult population. It does not measure fat directly the way a DXA scan, hydrostatic weighing or skinfold calipers do. Published validation studies report a standard error of roughly 3–5 percentage points for an individual, so a result of 22% realistically means "somewhere around 18–26%." Treat it as a screening estimate and a way to track change over time, not an exact figure.
Where it is least reliable
- Athletes and very muscular people: because the equation is driven by BMI, heavy muscle is counted toward weight and the formula tends to overestimate body fat for them.
- Older adults: people lose muscle and gain intramuscular fat with age at the same BMI, so estimates carry more uncertainty in the elderly even though the formula already adds an age term.
- Children and teens, pregnant women, and people with unusual body proportions: the equation was derived for non-pregnant adults and should not be applied to these groups.
This information is general and educational, not medical advice. If you are concerned about your body composition or what a result means for your health, consult a qualified healthcare professional or use a direct measurement method.
Body Fat Estimates Across Different Inputs
The table below shows how the estimated body fat percentage changes with weight, height, age and sex. BMI is computed as weight (kg) ÷ height (m)², then body fat follows from \( \text{BF\%} = 1.20\cdot\text{BMI} + 0.23\cdot\text{Age} - 10.8\cdot S - 5.4 \), where \(S = 1\) for men and \(0\) for women. Notice that, for the same BMI and age, women show a higher estimate because of the 10.8-point sex term.
| Sex | Weight | Height | Age | BMI | Estimated BF% |
|---|---|---|---|---|---|
| Male | 70 kg | 175 cm | 25 | 22.9 | 16.9% |
| Male | 90 kg | 175 cm | 25 | 29.4 | 24.7% |
| Male | 70 kg | 175 cm | 50 | 22.9 | 22.7% |
| Female | 60 kg | 165 cm | 25 | 22.0 | 26.7% |
| Female | 75 kg | 165 cm | 25 | 27.5 | 33.4% |
| Female | 60 kg | 165 cm | 50 | 22.0 | 32.5% |
Once you have a body fat percentage, you can convert it into actual fat mass and lean (fat-free) mass for a given body weight using a body fat to lean mass calculator. For the first row, that 16.9% on a 70 kg body works out to about 11.8 kg of fat and 58.2 kg of lean mass.
FAQ
Is this as accurate as a body fat scale or DEXA scan? No. It is a statistical estimate with a typical error of a few percentage points and does not measure fat directly. Use it for tracking trends, not as a clinical measurement.
Why does sex matter so much? The 10.8 coefficient accounts for women having higher essential body fat than men at the same BMI, age and build.
Does it work for children or athletes? The Deurenberg equation was derived for adults. It can overestimate fat in very muscular athletes and is not validated for children, who need age-and-sex-specific formulas.