
What is the Dice Roll Random Number Simulator?
This tool simulates rolling one to four standard six-sided dice a chosen number of times. Each roll uses a uniform random number, so every face from 1 to 6 has an equal 1-in-6 chance. It is handy for board games, teaching probability, generating random outcomes, or just settling a decision without physical dice.
How to use it
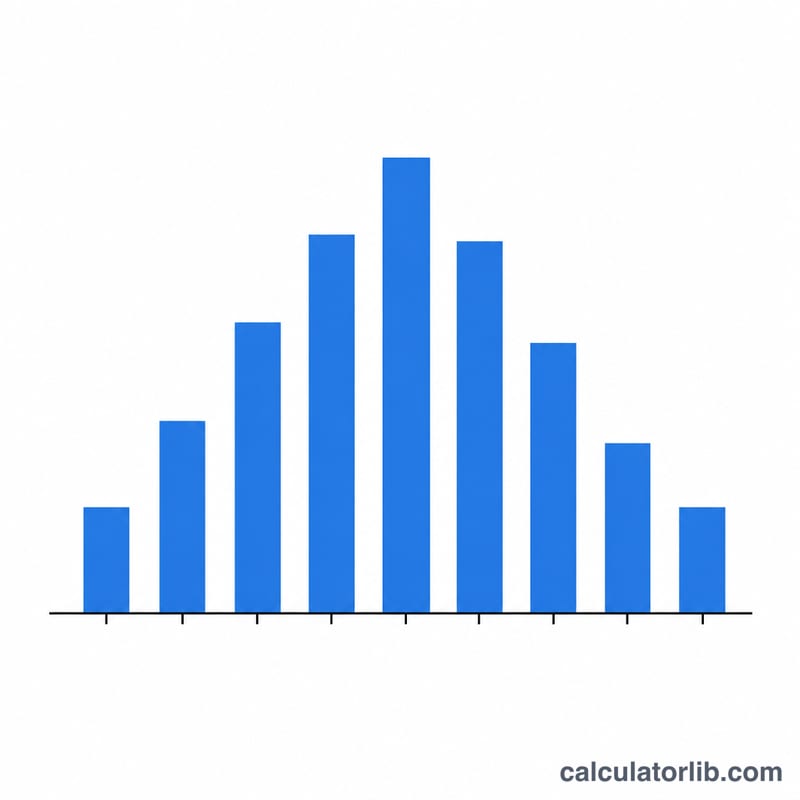
Enter the Number of trials (how many times the set of dice is rolled, from 1 to 100) and choose the Number of dice rolled at once (1 to 4). Press calculate. You will see a table with each trial's individual die faces and total, the sum of all totals, the average per trial, and a frequency distribution of the totals. Because results are random, running it again with the same inputs gives different rolls.
The formula explained
Each individual die value is computed as \(d = \left\lfloor \text{rand}() \times 6 \right\rfloor + 1\), where rand() is uniform in [0,1). This maps the interval evenly onto the integers 1 through 6. A trial's total is the sum of its dice, ranging from the dice count (all ones) up to six times the dice count (all sixes). The theoretical expected value of one die is 3.5, so the expected total per trial is 3.5 multiplied by the number of dice.
$$\text{Total}_t = \sum_{k=1}^{\text{Dice}} \left\lfloor 6 \cdot \text{rand}() \right\rfloor + 1$$$$\text{Average} = \frac{1}{\text{Trials}} \sum_{t=1}^{\text{Trials}} \text{Total}_t$$$$\text{Expected} = 3.5 \times \text{Dice}$$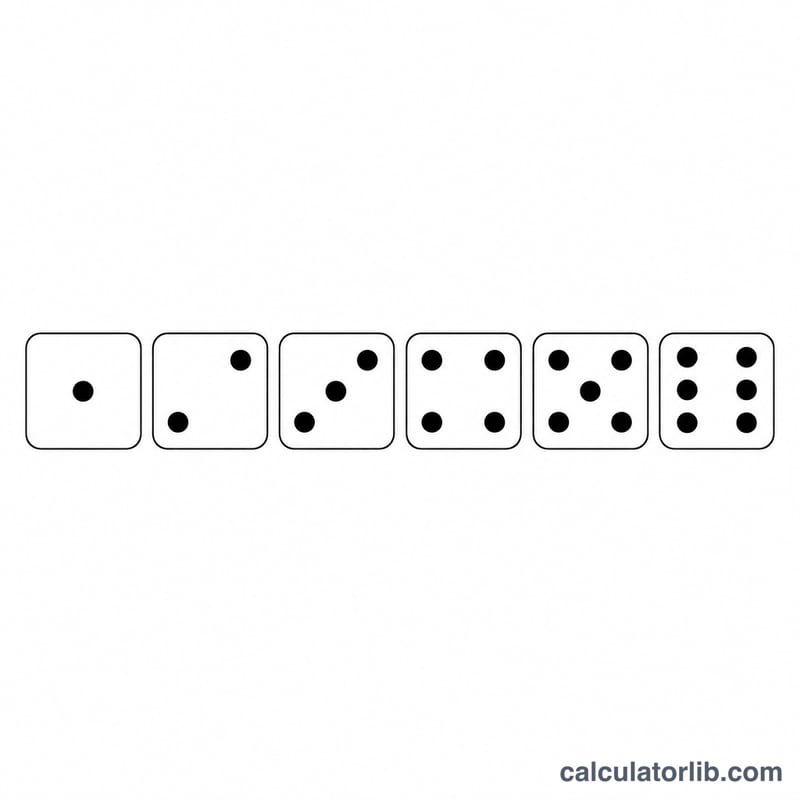
Worked example
Suppose you roll 2 dice for 5 trials and get: (3,5)=8, (1,6)=7, (4,4)=8, (2,3)=5, (6,2)=8. The grand total is \(8+7+8+5+8 = 36\), and the average per trial is \(36 / 5 = 7.2\). The theoretical expected total for 2 dice is \(3.5 \times 2 = 7.0\), which the average approaches as the number of trials grows.
FAQ
Why does my average differ from the expected value? With few trials, randomness causes variation. Over many trials the average converges toward 3.5 per die.
Can I roll more than four dice? No. This simulator supports 1 to 4 dice at once.
Are the results truly random? They use a pseudo-random generator that produces a uniform distribution suitable for games and demonstrations.