
What this calculator does
This tool estimates the cumulative probability of being involved in at least one fatal airplane accident if you took exactly one flight every single day for a chosen number of years. It is a pure probability calculation (the classic "at least once" rule), so the math is universal. It ships with two example per-flight rates: a "general aircraft" figure and a lower "U.S. aircraft" figure sourced from a U.S. National Transportation Safety Board (NTSB) study. You can replace either rate with your own value.
How to use it
Enter each per-flight fatal-accident probability as a percentage (for example 0.0009 means 0.0009%). Enter how many years you intend to fly daily. The calculator assumes 365 flights per year (no leap-year adjustment) and reports the probability for each rate side by side.
The formula explained
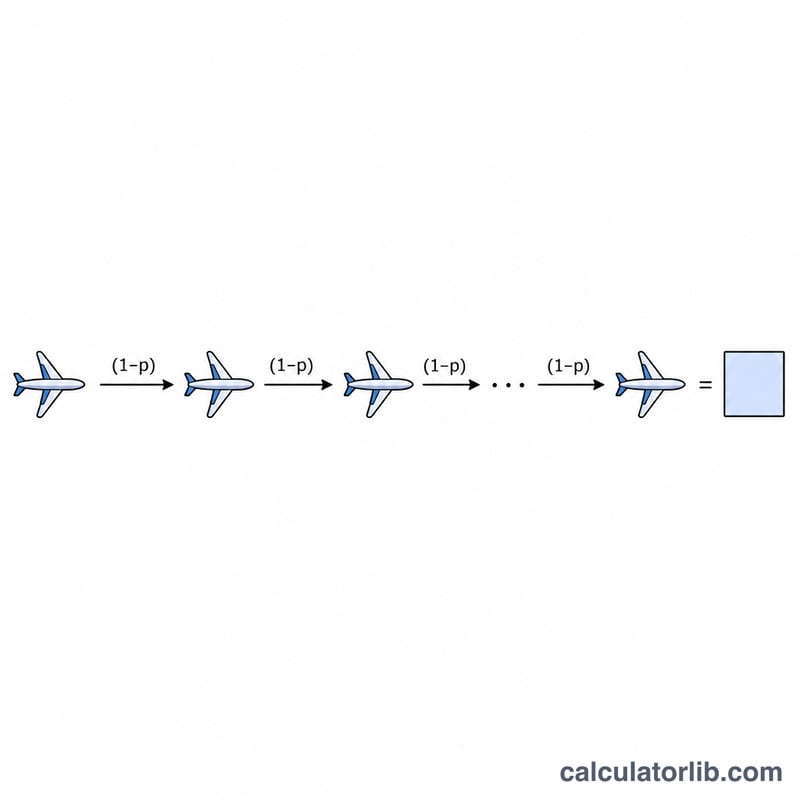
If a single flight has probability \(p\) of ending in a fatal accident, then the chance it does not is \(1 - p\). Over \(n\) independent flights the chance none of them is fatal is \((1 - p)^n\). The chance of at least one fatal flight is therefore \(1 - (1 - p)^n\), where \(n = 365 \times \text{years}\). We convert each percentage rate to a fraction by dividing by 100, and multiply the final result by 100 to display a percentage:
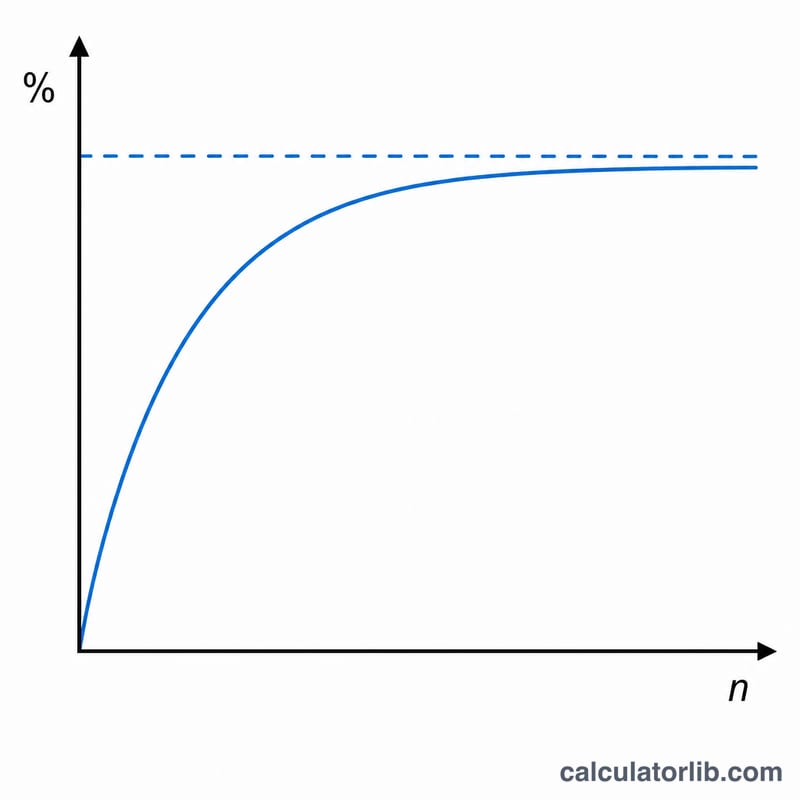
$$P = \left(1 - (1 - p)^{365 \times \text{years}}\right) \times 100$$Because of compounding, the result rises toward but never exceeds 100% — unlike a naive linear estimate (\(p \times n\)), which wrongly surpasses 100% after enough years.
Worked example
Using the defaults: general rate 0.0009% gives \(p = 0.000009\), and over 50 years \(n = 18{,}250\) flights. Then \((1 - 0.000009)^{18250} \approx 0.8485\), so the probability is about 15.15%. At the U.S. rate of 0.000034% (\(p = 0.00000034\)), the probability over the same 50 years is about 0.62%.
Documented Per-Flight Fatal-Accident Rates
Per-flight fatal-accident probability is the chance that any single departure ends in a fatal accident. It is far smaller than per-hour or lifetime figures because each flight is a discrete event. The widely cited values below are expressed both as a percentage and as a decimal fraction.
| Source / scope | Probability per flight (%) | Decimal fraction | Approx. "1 in" |
|---|---|---|---|
| U.S. major carriers (often attributed to NTSB-based analyses) | 0.000034% | 0.00000034 | 1 in ~2,940,000 |
| General / global commercial aviation figure | 0.0009% | 0.000009 | 1 in ~111,000 |
| Frequently quoted "1 in a million flights" benchmark | 0.0001% | 0.000001 | 1 in 1,000,000 |
Reported rates vary with the dataset, time window, region and how "fatal accident" is defined (any onboard fatality versus a hull loss). Use the figure that matches your region and the operator class you are evaluating; the calculator lets you enter a general rate and a U.S. rate separately.
Interpreting Your Result
The percentage this calculator returns is the output of a deliberately simple hypothetical model, not a forecast about you personally. It assumes you take exactly one flight every single day, that every flight carries the same constant per-flight risk \(p\), and that each flight is statistically independent of the others. Real travel does none of these things consistently.
Because the flights are treated as independent trials, the chance of avoiding a fatal accident across \(n\) flights is \((1-p)^{n}\), and the chance of experiencing at least one is its complement, \(1-(1-p)^{n}\). As \(n\) grows, that complement creeps upward toward — but never actually reaches — 100%. This asymptotic behavior is pure compounding of many tiny probabilities; it does not mean an accident becomes inevitable or "overdue." Each individual flight always carries the same small \(p\), regardless of how many safe flights came before it.
Real-world risk is not uniform. It varies by airline and its safety record, aircraft type and age, route, weather, airport, phase of flight, and the era of the data. Modern commercial aviation in well-regulated regions is among the safest forms of transportation, and headline lifetime figures are usually dominated by a handful of rare events rather than steady daily exposure. Treat the result as an illustration of how rare events accumulate over enormous numbers of trials — useful for intuition about probability, not as a personal safety prediction or a reason to change travel plans.
FAQ
Why two rates? They illustrate how a much smaller per-flight risk (the NTSB-sourced U.S. figure) translates into a far lower cumulative risk over decades.
Does it count leap years? No — it fixes the year at 365 days to keep the model simple.
Can the result exceed 100%? No. The compound formula asymptotically approaches 100% but never reaches or exceeds it for any finite duration.