
What Is Net Profit Margin?
Net profit margin is one of the most important profitability ratios in business. It measures how much of every dollar of revenue a company keeps as profit after subtracting all costs — including operating expenses, interest, taxes, and one-time charges. A higher net margin means a more profitable, efficient company.
How to Use This Calculator
Enter your net income (the bottom-line profit after every expense) and your total revenue (sales or turnover) for the same period. The calculator divides net income by revenue and multiplies by 100 to express the result as a percentage.
The Formula Explained
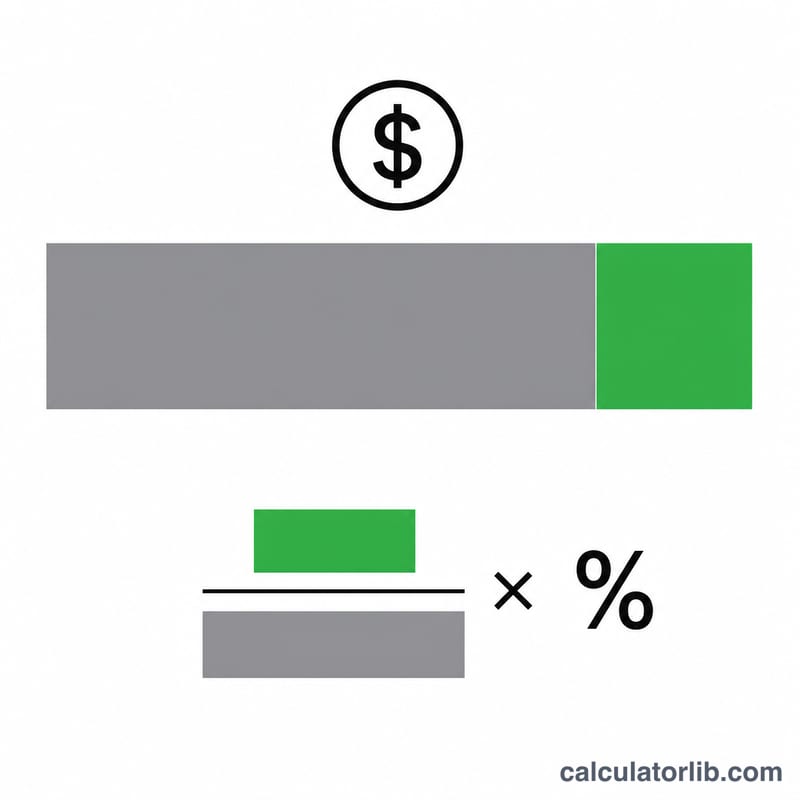
The equation is simple:
$$\text{Net Margin} = \frac{\text{Net Income}}{\text{Revenue}} \times 100\%$$Net income comes from the bottom of the income statement; revenue is the top line. Because both figures use the same currency and period, the ratio is dimensionless and comparable across companies of different sizes.
Worked Example
Suppose a company earns $150,000 in net income on $1,000,000 of revenue. The net margin is
$$150{,}000 \div 1{,}000{,}000 \times 100 = \mathbf{15\%}$$That means the business keeps 15 cents of profit from every dollar of sales.
Typical Net Profit Margins by Industry
Net margins differ widely between sectors because of differences in cost structure, capital intensity, pricing power and competition. The ranges below are rough, general figures for typical mature companies. They are not fixed standards. They shift from year to year and depend on the source, the country, the sample of companies and how the figures are averaged. Public datasets such as the NYU Stern (Damodaran) industry tables publish updated margins by sector, and those are a good place to check current values.
| Sector | Approximate net margin range | Why it tends to look this way |
|---|---|---|
| Software / SaaS | ~10% to 25% | Low cost per additional customer, but heavy spending on R&D and sales; young firms are often negative |
| Banking | ~15% to 30% | Revenue is interest and fees; margins swing with interest rates and credit losses |
| Pharmaceuticals | ~10% to 25% | High margins on patented drugs, offset by large R&D costs and patent expiries |
| Restaurants | ~3% to 10% | High labor, food and rent costs |
| Retail / grocery | ~1% to 4% | High volume at low markups |
| Airlines | ~0% to 6% (very volatile) | High fixed costs, fuel and labor; losses are common in downturns |
| Construction / engineering | ~2% to 6% | Competitive bidding and project-cost risk |
| Manufacturing (general) | ~5% to 10% | Materials, labor and capital costs; varies by product type |
Treat these as orientation only. A company's own size, business model, accounting choices and stage of growth can place it well outside its sector's typical range.
Interpreting Your Net Profit Margin
Net profit margin shows how many cents of each revenue dollar remain as profit after all expenses, including cost of goods, operating costs, interest and taxes:
$$\text{Net Margin} = \frac{ \text{Net Income} }{ \text{Revenue} } \times 100\%$$
What the bands generally mean
- Negative: the business lost money in the period; expenses exceeded revenue.
- 0% to 5%: thin. Small changes in costs or prices can push the result into a loss.
- 5% to 10%: moderate.
- 10% to 20%: generally healthy.
- 20% and above: strong, and usually tied to pricing power, low costs or a distinctive business model.
These bands are rules of thumb. A 3% margin can be normal for a grocery chain, while the same figure would be weak for a software company.
What can distort net margin
- One-time items: asset sales, legal settlements, restructuring charges, write-downs or insurance payouts can raise or lower net income for a single period without reflecting normal operations.
- Interest: companies with more debt pay more interest, which lowers net margin compared with a similar firm that has less debt.
- Taxes: tax rates, credits and loss carryforwards differ by country and over time, so net margin can change even when operations do not.
Comparing results
- Compare against peers in the same industry and of similar size, using the same accounting period and definitions.
- Compare with your own prior periods (quarter over quarter or year over year) to see the trend. Watch for seasonality when comparing quarters.
- Consider looking at gross and operating margins alongside net margin to see where changes originate.
This is general information for understanding the metric, not financial or professional advice.
Net Margin Scenarios Compared
With revenue held constant at $1,000,000, the table shows how net income changes the net profit margin. Each margin is net income ÷ revenue × 100%.
| Revenue | Net Income | Net Margin | Label |
|---|---|---|---|
| $1,000,000 | -$50,000 | -5.0% | Loss |
| $1,000,000 | $20,000 | 2.0% | Thin |
| $1,000,000 | $80,000 | 8.0% | Moderate |
| $1,000,000 | $150,000 | 15.0% | Healthy |
| $1,000,000 | $250,000 | 25.0% | Strong |
Worked substitution for the moderate case: \(\frac{80{,}000}{1{,}000{,}000} \times 100\% = 8.0\%\). For the loss case: \(\frac{-50{,}000}{1{,}000{,}000} \times 100\% = -5.0\%\).
The labels follow the general bands described above and should be read in the context of your industry.
FAQ
What is a good net profit margin? It varies by industry. Software firms may exceed 20%, while grocery retailers often run below 5%. Compare against peers in the same sector.
How is net margin different from gross margin? Gross margin only subtracts the cost of goods sold, while net margin subtracts all expenses including operating costs, interest, and taxes.
Can net margin be negative? Yes. If net income is negative (a loss), the net margin will be negative, indicating the company spent more than it earned.