What This Calculator Does
The Stock Price Percent Gain/Loss Calculator tells you how much your investment moved in percentage terms between the price you paid (buy price) and the price you sold at (sell price). It also shows your profit per share and your total profit or loss if you enter the number of shares you held. This is a universal financial math tool — it works for any currency, market, or jurisdiction.
How to Use It
Enter the price you bought the stock at, the price you sold it at, and optionally the number of shares you owned. The calculator returns the percentage change as well as the dollar figures. A positive result is a gain; a negative result is a loss. If you only care about the percentage, leave shares as 1.
The Formula Explained
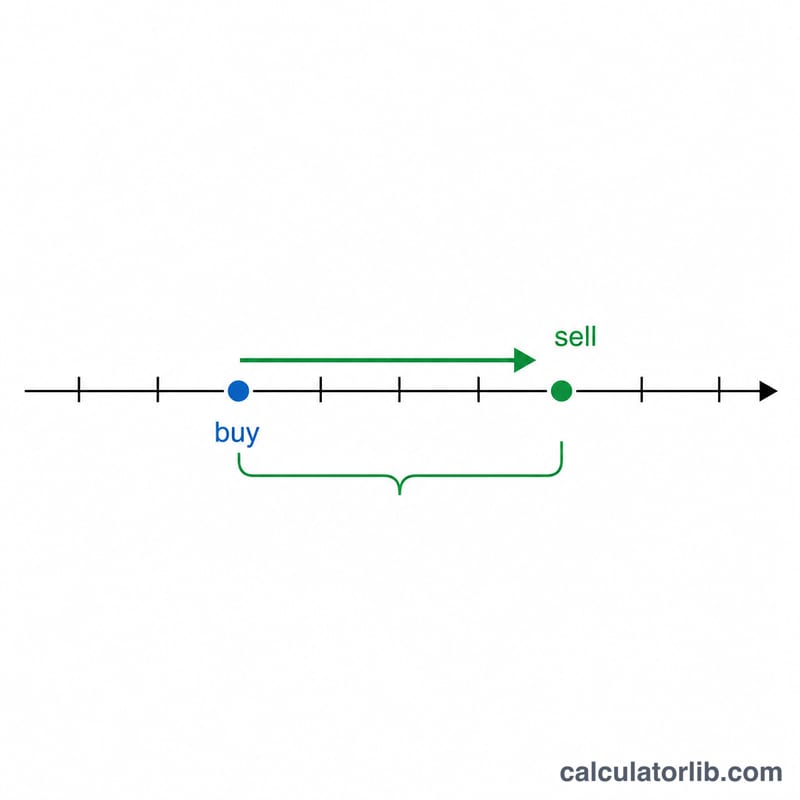
The core formula is straightforward: subtract the buy price from the sell price to get the dollar change, divide that by the original buy price, and multiply by 100 to convert to a percentage. Dividing by the buy price (your starting basis) is what makes the result a true percentage change rather than just a dollar difference.
$$\text{pct} = \frac{\text{sellPrice} - \text{buyPrice}}{\text{buyPrice}} \times 100$$
Worked Example
Suppose you bought shares at $100 and sold at $125, holding 10 shares. The change is \(\$125 - \$100 = \$25\) per share. Divided by $100 gives 0.25, and multiplied by 100 gives a 25% gain. Your profit per share is $25, and across 10 shares your total profit is $250. Your total cost was $1,000 and your total value at sale was $1,250.
$$\text{pct} = \frac{125 - 100}{100} \times 100 = 25\%$$
Gain and Loss Scenarios at a Glance
Each row uses the formula \(\text{Percent Change} = \frac{ \text{Sell} - \text{Buy} }{ \text{Buy} } \times 100\%\). Profit per share is Sell − Buy, and total profit/loss is profit per share × shares. Prices are in dollars for illustration; the math is the same in any currency.
| Scenario | Buy Price | Sell Price | Shares | Percent Change | Profit per Share | Total Profit/Loss |
|---|---|---|---|---|---|---|
| Modest gain | $50.00 | $55.00 | 100 | +10% | +$5.00 | +$500.00 |
| Large gain | $20.00 | $60.00 | 50 | +200% | +$40.00 | +$2,000.00 |
| Small loss | $80.00 | $72.00 | 100 | −10% | −$8.00 | −$800.00 |
| Large loss | $100.00 | $50.00 | 20 | −50% | −$50.00 | −$1,000.00 |
| Break-even | $40.00 | $40.00 | 100 | 0% | $0.00 | $0.00 |
Example check for the large gain: \(\frac{60 - 20}{20} \times 100\% = 200\%\), and \(40 \times 50 = 2{,}000\) dollars total.
Interpreting Your Percent Gain or Loss
A positive result means the sell price was higher than the buy price, so the position gained value. A negative result means the sell price was lower than the buy price, so it lost value. Zero means the two prices were equal.
Percentage changes are measured against the starting price, so recovering from a loss is asymmetric. After a loss, the price base is smaller, so a larger percentage gain is needed to return to the original price. For a loss fraction \(L\), the gain required to break even is:
$$\text{Required gain} = \frac{L}{1 - L}$$
For example, a stock bought at $100 that falls 50% is worth $50. Getting back to $100 requires \(\frac{100 - 50}{50} \times 100\% = 100\%\). A 20% drop to $80 requires \(\frac{100 - 80}{80} \times 100\% = 25\%\).
| Loss | Gain Needed to Break Even |
|---|---|
| 10% | 11.1% |
| 20% | 25% |
| 33% (about one-third) | 50% |
| 50% | 100% |
| 75% | 300% |
Keep in mind that the result is a raw price return between two prices. It is not annualized, so it says nothing about how long the position was held. It also excludes brokerage fees, commissions, taxes, and dividends, all of which affect what you actually keep. This is general information, not financial or tax advice.
Key Terms
- Buy price: the price paid per share, which is your cost basis per share (before any fees).
- Sell price: the price received per share when the position is sold or valued.
- Percent change: the difference between sell and buy price divided by the buy price, expressed as a percentage.
- Profit per share: sell price minus buy price. A negative value is a loss per share.
- Total profit/loss: profit per share multiplied by the number of shares.
- Shares: the number of units of the stock bought and sold.
Price return vs. total return: price return looks only at the change in share price, which is what this calculator computes. Total return also includes dividends and other distributions, and can be reduced by fees and taxes, so it can differ noticeably from price return.
FAQ
Does this account for fees or taxes? No. It shows the raw price-based gain or loss. Subtract brokerage commissions and any capital gains tax separately for your net return.
Can it show a loss? Yes. If your sell price is below your buy price, the percentage and dollar figures will be negative, indicating a loss.
What if I reinvested dividends? This tool only uses price. For total return including dividends, add the dividends received to your sell value before calculating.