What is the SAT Percentile Calculator?
This calculator estimates the percentile rank of a total SAT score (United States, current 400–1600 scale). A percentile tells you the percentage of test-takers who scored at or below your score. For example, a 75th percentile score means you scored higher than about 75% of students who took the SAT.
How to use it
Enter your composite SAT score between 400 and 1600 and the calculator returns your estimated percentile, the percentage of test-takers who scored higher, and your z-score. The estimate models the national SAT distribution as a normal curve with a mean of 1050 and a standard deviation of 205, values close to College Board's nationally representative sample. Actual published percentiles vary slightly by year and cohort.
The formula explained
We convert your score to a z-score, \( z = \frac{\text{score} - 1050}{205} \), then apply the standard normal cumulative distribution function \( \Phi(z) \). Multiplying by 100 gives the percentile. We use the Abramowitz & Stegun polynomial approximation of \( \Phi \) for fast, accurate computation.
$$\text{Percentile} = \Phi(z) \times 100, \qquad z = \frac{\text{SAT Score} - 1050}{205}$$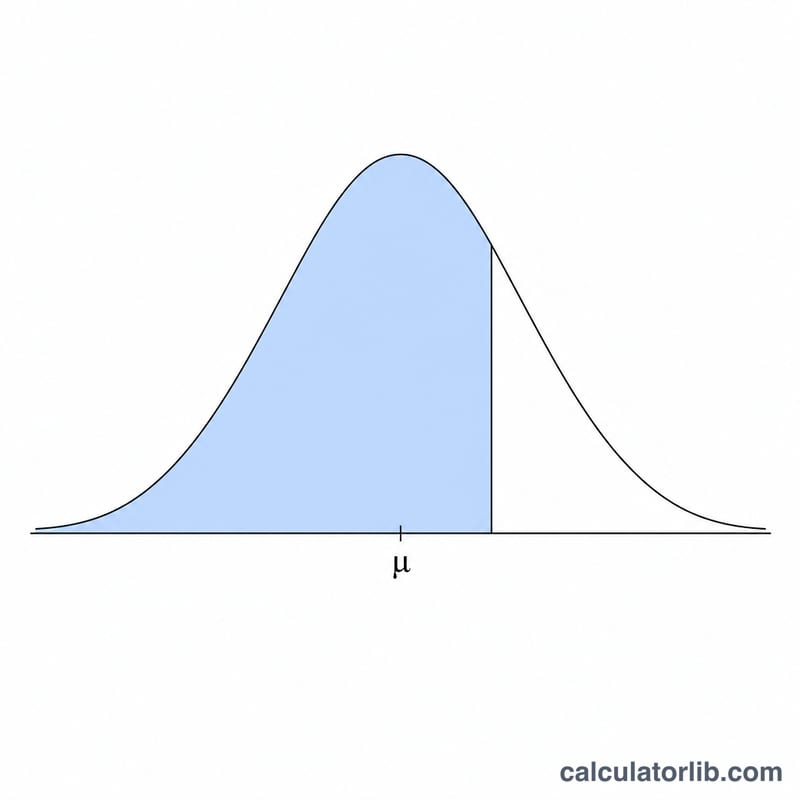
Worked example
For a score of 1260: \( z = \frac{1260 - 1050}{205} \approx 1.024 \). \( \Phi(1.024) \approx 0.8472 \), so the percentile is about 84.7. That means a 1260 beats roughly 85% of test-takers, and about 15% scored higher.
$$z = \frac{1260 - 1050}{205} \approx 1.024, \qquad \Phi(1.024) \approx 0.8472$$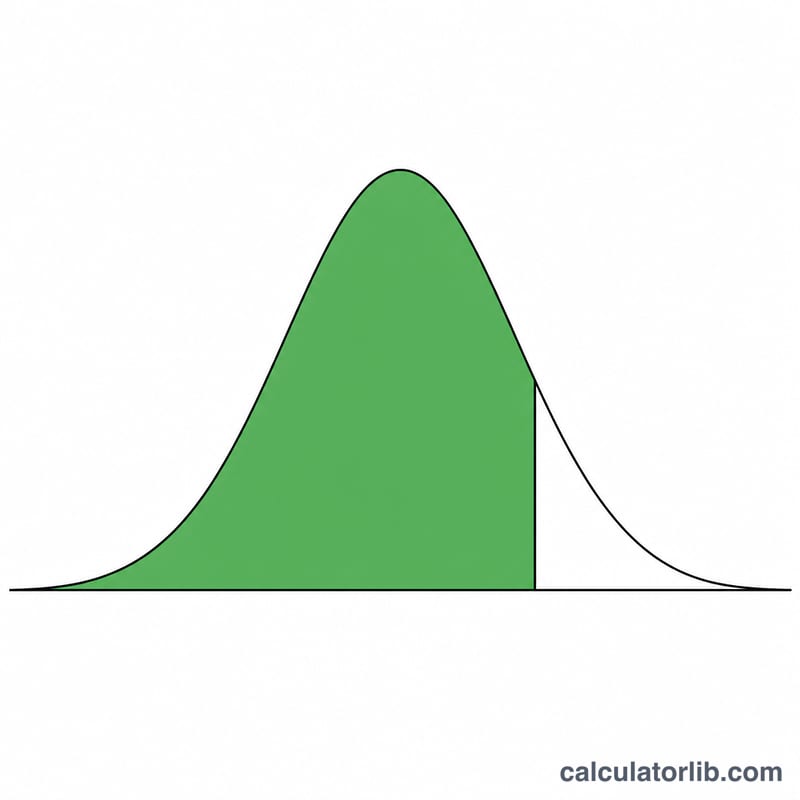
FAQ
Is this the official percentile? No — it is a statistical estimate. The College Board publishes official percentiles each year; small differences are expected.
Why mean 1050 and SD 205? These approximate the nationally representative SAT total distribution used by the College Board.
Does it work for the old 2400 scale? No. This tool uses the current 400–1600 total-score scale.