What this calculator does
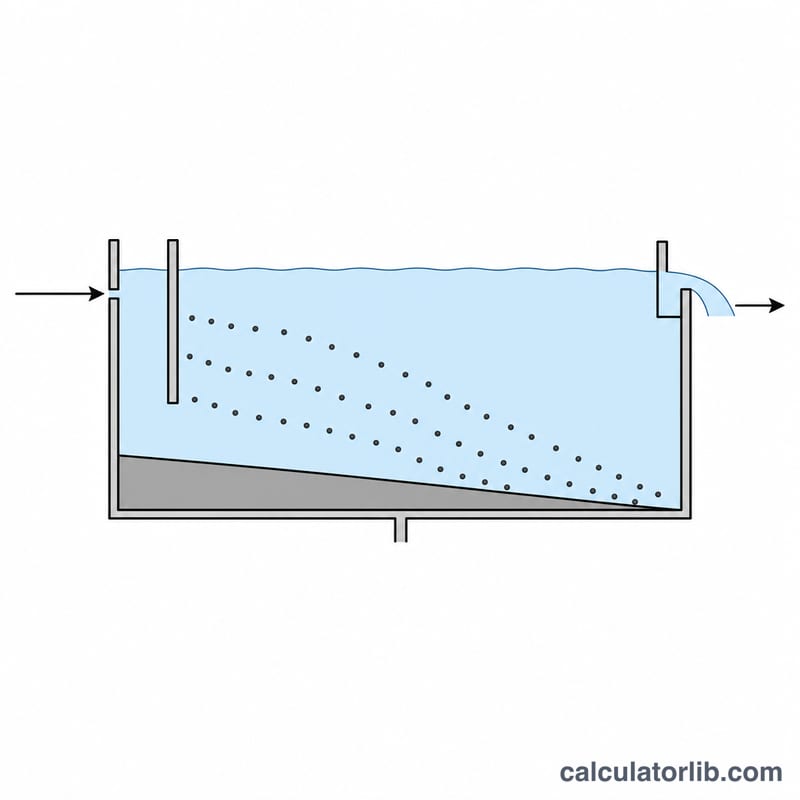
The volumetric loading rate — also called the hydraulic loading rate on a volume basis — tells you how many times the entire contents of a sedimentation (settling) basin are replaced each day. It is one of the fastest sanity checks on a clarifier design: if water sweeps through the tank too quickly, flocculated particles never reach the sludge zone and carry over to the filters. The tool is unit-consistent in SI (metres and cubic metres per day) and applies to any jurisdiction, since it is pure hydraulics rather than a regulatory rule.
The formula
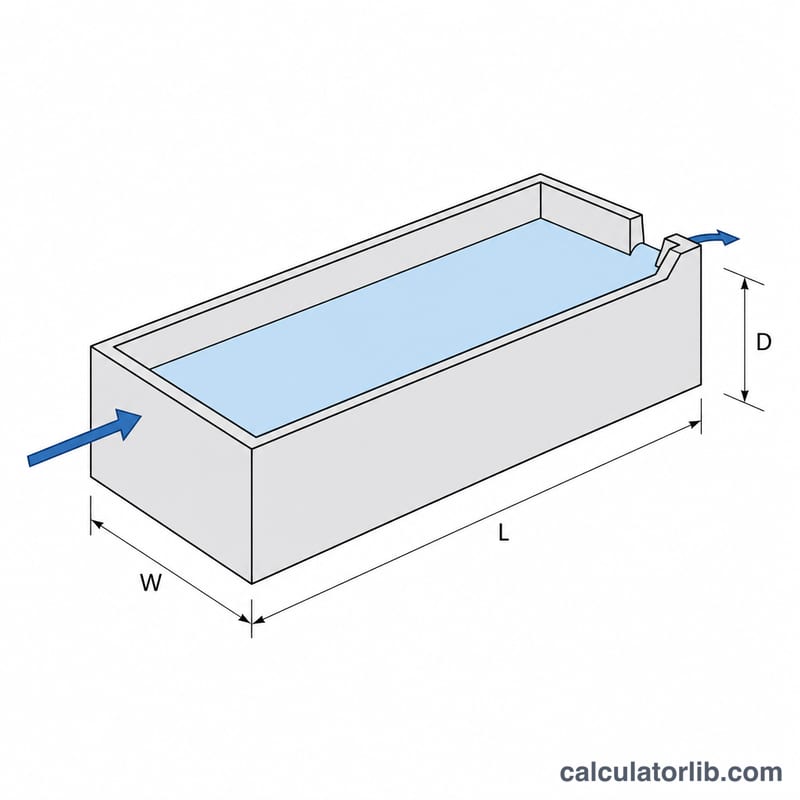
With \(Q\) = inflow rate in m³/day, \(L\), \(W\) and \(D\) = basin length, width and side water depth in metres, and \(V = L \times W \times D\) the basin volume:
$$\text{VLR} = \frac{Q}{V} = \frac{Q}{L \times W \times D}$$The result carries units of day\(^{-1}\). Its reciprocal is the theoretical detention time, \(t = 24/\text{VLR}\) hours. The calculator also reports the surface overflow rate \(v_o = Q/(L \times W)\), the settling velocity a particle must exceed to be captured.
How to use it
Enter the internal length, width and side water depth of the basin, then the average design inflow. Use the water depth, not the wall height — freeboard is not working volume. If you already know the volume, enter any dimensions whose product matches it.
Worked example
A rectangular basin measures 30 m long, 10 m wide, with 4 m of water depth, treating 6,000 m³/day.
$$V = 30 \times 10 \times 4 = 1200\,\text{m}^3$$$$\text{VLR} = \frac{6000}{1200} = 5.0\ \text{day}^{-1}$$$$t = \frac{24}{5.0} = 4.8\,\text{hours}, \qquad v_o = \frac{6000}{300} = 20\ \text{m}^3/\text{m}^2/\text{day}$$Both figures sit inside common design envelopes, so the basin is adequately sized for that flow.
Typical Design Ranges for Sedimentation Basins
Sedimentation basins are sized primarily by surface overflow rate (SOR) and detention time; the volumetric loading rate (VLR) is simply the reciprocal of detention time expressed per day. If detention time \(t\) is in hours, then
$$\text{VLR}\ (\text{day}^{-1}) = \frac{Q}{V} = \frac{24}{t}$$
The bands below are typical values from widely used North American design references. They are engineering guidance, not law: the regulatory minimum in the jurisdiction where the plant is permitted always overrides a typical value. In the United States, for example, the Recommended Standards for Water Works (the Great Lakes–Upper Mississippi River Board "Ten States Standards") sets minimum detention times for potable water clarifiers that many states adopt as enforceable rules; other countries apply their own codes (e.g. EN standards and national water-authority rules in Europe), so the numbers below should not be read as universal.
| Basin type | Detention time \(t\) (h) | VLR = 24/t (day⁻¹) | Surface overflow rate (m³/m²·d) | SOR (gpd/ft²) | Weir loading (m³/m·d) | Flow basis | Typical source |
|---|---|---|---|---|---|---|---|
| Conventional rectangular clarifier, water treatment (after coagulation/flocculation) | 2–4 | 6–12 | 20–40 | ≈490–980 | ≈150–300 | Design (max-day) flow | Ten States Standards; MWH's Water Treatment: Principles and Design |
| Upflow / solids-contact (sludge-blanket) clarifier | 1–2 (softening) to 2–4 (turbidity removal) | 6–24 | 35–60 | ≈860–1,470 | ≈150–260 | Design (max-day) flow | Ten States Standards; MWH |
| Primary settling tank, municipal wastewater | 1.5–2.5 | ≈10–16 | 30–50 (avg); 80–120 (peak) | ≈740–1,230 avg | ≈125–500 | Average flow, checked at peak hour | Metcalf & Eddy, Wastewater Engineering; WEF MOP 8 |
| Secondary clarifier following conventional activated sludge | 1.5–2.5 | ≈10–16 | 16–28 (avg); 40–48 (peak) | ≈390–690 avg | ≈125–375 | Average flow, checked at peak hour | Metcalf & Eddy; WEF MOP 8 |
| High-rate tube or plate (lamella) settler | 0.2–0.5 (basin only) | ≈48–120 | 40–80 (on plan area) | ≈980–1,960 | ≈150–300 | Design (max-day) flow | MWH; Ten States Standards high-rate provisions |
Reading the table:
- Average vs peak basis matters. Wastewater clarifier overflow rates are conventionally quoted at average daily flow with a separate, higher allowable value at peak hourly flow; water-treatment clarifiers are usually rated at the plant's design maximum-day flow, so there is no separate peak allowance. Comparing a computed VLR against the wrong basis can make a compliant basin look overloaded, or the reverse.
- High-rate settlers look extreme in VLR terms because the settling volume is subdivided by plates or tubes: the effective settling area is many times the plan area, so a very short detention time is still adequate. Do not compare a lamella VLR directly against a conventional clarifier VLR.
- Sludge blanket depth, water temperature (cold water is more viscous and settles more slowly) and upstream flocculation quality all shift the practical limit within these bands.
Interpreting Your Volumetric Loading Rate
Volumetric loading rate and theoretical detention time are two views of the same number:
$$\text{VLR} = \frac{Q}{V}\ (\text{day}^{-1}), \qquad t = \frac{24}{\text{VLR}}\ (\text{hours})$$
A VLR of 12 day⁻¹ means the basin contents are theoretically replaced twelve times per day — a 2-hour nominal detention time.
What each band indicates
| Band | Detention time | VLR (day⁻¹) | What it factually indicates |
|---|---|---|---|
| Low loading | > 6 h | < 4 | Basin is large relative to current flow — often an oversized unit running below design flow, or too many units in service. Long residence favours anaerobic conditions in the sludge blanket: septicity, odour and hydrogen sulfide. In nitrified wastewater, denitrification in the blanket generates nitrogen gas that floats sludge to the surface. Low velocities also let dead zones develop, so much of the extra volume does no settling work. |
| Typical | ≈ 1.5–4 h | ≈ 6–16 | Turnover consistent with the design bands for conventional clarifiers. Confirms the basin volume is in the expected relationship to flow — it does not by itself confirm effluent quality. |
| High loading | < 1.5–2 h | > 12–16 | Particles whose settling velocity is below the critical velocity \(v_0\) escape with the effluent. In water treatment this means floc carryover to the filters: shorter filter runs, higher backwash frequency and eventual turbidity breakthrough. In secondary clarifiers it means solids loss and rising effluent TSS. Acceptable only for high-rate settlers or basins specifically designed for it. |
Why VLR and surface overflow rate must be read together
They answer different questions. Under Hazen's overflow-rate theory, an ideal rectangular basin captures every discrete particle whose settling velocity exceeds the critical velocity, and that critical velocity equals the surface overflow rate:
$$v_0 = \frac{Q}{A} = \text{SOR}$$
Note what is absent: depth. For discrete, non-flocculating particles, capture efficiency depends on surface area, not volume — a shallow wide basin and a deep narrow basin with the same plan area remove the same particles in theory. VLR governs the other half of the problem. Since \(\text{SOR}/\text{VLR}\) is just the basin depth, VLR expresses contact time for flocculation, buffering against hydraulic surges, and room to store a sludge blanket. A basin can meet its SOR target and still perform poorly because detention time is too short for floc to grow, or meet its detention target while the surface is overloaded.
Both numbers are theoretical
- They assume ideal plug flow with no short-circuiting, no density currents, no wind effects and uniform inlet distribution. Real basins deviate substantially.
- Tracer studies routinely show that the actual mean residence time — and especially \(t_{10}\), the time for 10% of tracer to appear at the outlet — is only about 30–70% of the theoretical value in conventional basins. Poor inlet baffling, thermal stratification and short-circuiting are the usual causes. A tracer study (fluoride, lithium chloride or rhodamine WT) is the only way to measure this on a real basin.
- Where disinfection contact credit is involved, regulators generally require the measured \(t_{10}\) rather than the calculated volume-over-flow value — in the United States this is the basis of the CT approach under the Surface Water Treatment Rule.
Treat the computed VLR as an engineering screening indicator: useful for sizing checks, comparing units and flagging a basin far outside typical practice. It is not a compliance determination, and it does not replace jar tests, settling-column tests, tracer studies, solids-flux analysis for secondary clarifiers, or the judgment of a licensed engineer working to the applicable local standard.
FAQ
What is a good volumetric loading rate? Conventional water-treatment clarifiers usually run 2–4 hours detention, i.e. roughly 6–12 day\(^{-1}\). High-rate plate or tube settlers tolerate far higher values.
How does it differ from surface loading rate? Volumetric loading divides flow by volume and measures turnover; surface loading divides flow by plan area and measures the critical settling velocity. Sizing decisions normally check both.
Should I use average or peak flow? Check both: average flow for routine performance and peak hourly flow for the worst-case carryover condition.