What this calculator does
This tool builds a soccer (association football) league standings table from each team's match record. You enter every team's wins, draws, losses, goals scored and goals conceded, and it computes points, matches played and goal difference, then ranks all teams from best to worst. It is a universal sports tool that follows the standard FIFA/league points and tie-break logic, so it works for any competition worldwide.
How to use it
Set the number of teams (2-32) and confirm the scoring (the modern default is 3 points for a win, 1 for a draw, 0 for a loss; switch to 2-1-0 for older systems). Fill in each row with W, D, L, GF and GA. Blank cells are treated as 0, so a team that has not played yet simply stays at the bottom with 0 points.
The formula explained
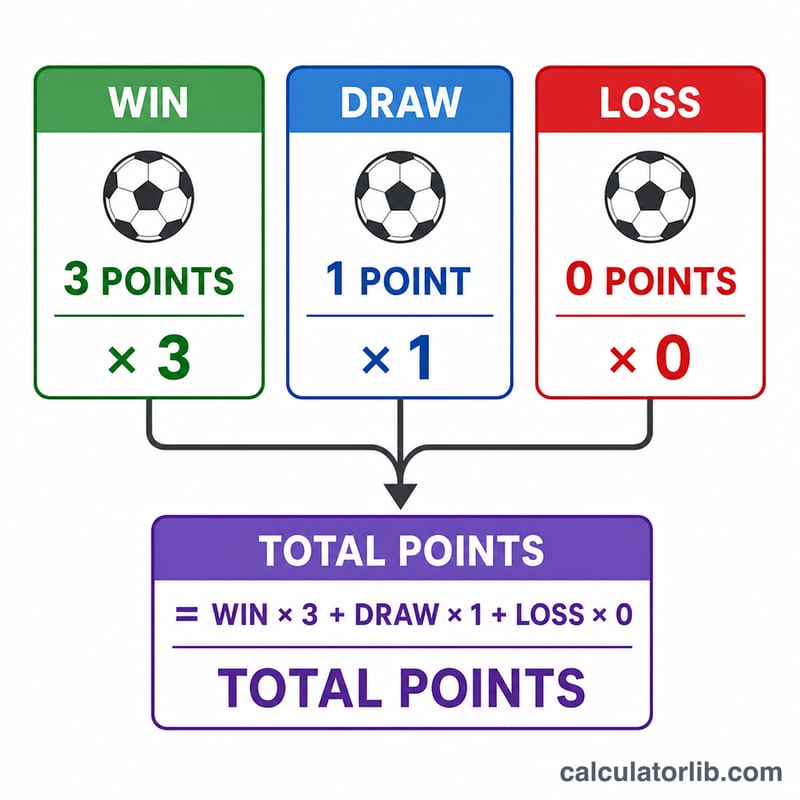
For each team, points are $$\text{Pts} = W \times p_w + D \times p_d + L \times p_l$$ and goal difference is $$\text{GD} = \text{GF} - \text{GA}$$ Matches played is \(W + D + L\). Teams are then sorted by a three-level comparison: (1) higher points first, (2) if tied, higher goal difference, (3) if still tied, more goals scored (GF). Any teams that remain equal on all three keep their input order.
Worked example
Four teams with 3-1-0 scoring: A (W3 D1 L0, 9-3), B (W2 D2 L0, 7-4), C (W2 D1 L1, 6-5), D (W2 D1 L1, 8-7). Points: \(A=10\), \(B=8\), \(C=7\), \(D=7\). C and D tie on points and on GD (+1), so goals scored breaks it: D's 8 beats C's 6. Final table: 1) A 10pts, 2) B 8pts, 3) D 7pts, 4) C 7pts.
Standings Table Abbreviations and Terms
- P / MP – matches played: \(P = W + D + L\).
- W – wins.
- D – draws.
- L – losses.
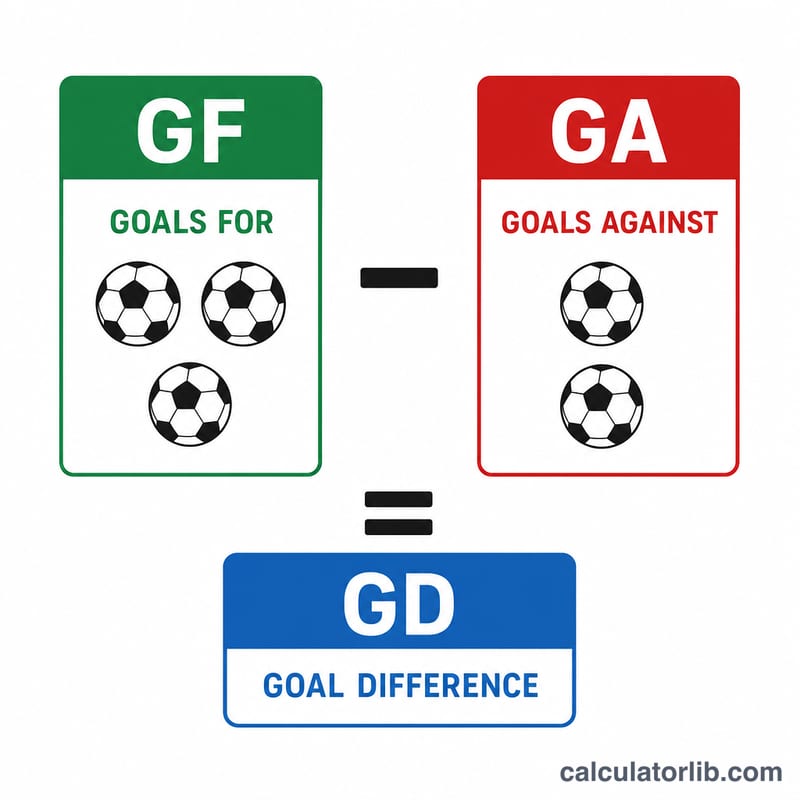
- GF – goals for: the total goals a team has scored.
- GA – goals against: the total goals a team has conceded.
- GD – goal difference: \(\text{GD} = \text{GF} - \text{GA}\). It can be negative.
- Pts – points: \(\text{Pts} = W \cdot p_W + D \cdot p_D + L \cdot p_L\). The usual values are \(p_W = 3\), \(p_D = 1\), \(p_L = 0\), but you can change them in the calculator.
- Tie-breaker – the rule used to order teams that have the same number of points.
Head-to-head means ranking tied teams by the results of the matches played only between them (their points, and often their goal difference, in those games). The goal-based tie-break used in this calculator looks at each team's whole-season record instead: first goal difference, then goals scored. Head-to-head needs individual match results, which a W-D-L and goals summary does not contain.
Tie-Break Rules in Major Leagues
When teams are level on points, leagues apply different orders of tie-breakers. The table below gives the general pattern for several well-known European leagues. These rules are set by each competition and are sometimes revised, so check the current official regulations before relying on them.
| Competition | Order when points are equal (general outline) |
|---|---|
| Premier League (England) | 1) Overall goal difference, 2) overall goals scored, 3) if still level, a play-off at a neutral venue can decide the title or relegation. Head-to-head is not used before goal difference. |
| La Liga (Spain) | Head-to-head results between the tied teams first, then overall goal difference (further criteria follow). |
| Serie A (Italy) | Head-to-head results between the tied teams first, then overall goal difference (further criteria follow). |
| Bundesliga (Germany) | 1) Overall goal difference, 2) overall goals scored, then later criteria such as head-to-head. |
Points systems
| System | Win | Draw | Loss |
|---|---|---|---|
| 3-1-0 (the standard in most modern leagues) | 3 | 1 | 0 |
| 2-1-0 (the older system, still used in some competitions) | 2 | 1 | 0 |
What this calculator does: it ranks teams by points, then goal difference, then goals scored (GF) only. It does not apply head-to-head, play-offs, fair-play points or other later criteria. If your league uses head-to-head first (as in La Liga or Serie A), the order for tied teams may differ from the official table.
3-1-0 vs 2-1-0 Scoring: Same Record, Different Points
Each team below has played 10 matches. The goal totals are hypothetical and are used only for the goal-difference tie-break.
| Team | W-D-L | GF-GA (GD) | Pts at 3-1-0 | Pts at 2-1-0 |
|---|---|---|---|---|
| Team A | 5-2-3 | 18-11 (+7) | 5·3 + 2·1 = 17 | 5·2 + 2·1 = 12 |
| Team B | 4-6-0 | 12-9 (+3) | 4·3 + 6·1 = 18 | 4·2 + 6·1 = 14 |
| Team C | 6-0-4 | 15-14 (+1) | 6·3 + 0·1 = 18 | 6·2 + 0·1 = 12 |
Resulting order
- 3-1-0: Team B and Team C are level on 18 points. Team B has the better goal difference (+3 vs +1), so the order is B, C, A.
- 2-1-0: Team B leads with 14. Team A and Team C are level on 12, and Team A has the better goal difference (+7 vs +1), so the order is B, A, C.
Team A and Team C swap places. The 3-1-0 system rewards wins more heavily, so Team C, with six wins, gains ground on Team A, which has five wins. The 2-1-0 system narrows the gap between a win and a draw, which favors Team B, whose record is mostly draws. Set the points for a win, draw and loss in the calculator to see how any record changes between systems.
FAQ
Why is goal difference used before goals scored? Most leagues rank equal-point teams first by goal difference, then by goals scored, which is exactly the order this tool applies.
Can a team have 0 matches? Yes. All-zero teams get 0 points and 0 goal difference and sort to the bottom.
Does it check that the results are consistent? No. Each row is taken as entered; total league wins need not equal total losses.