What the Turbo Boost Calculator Does
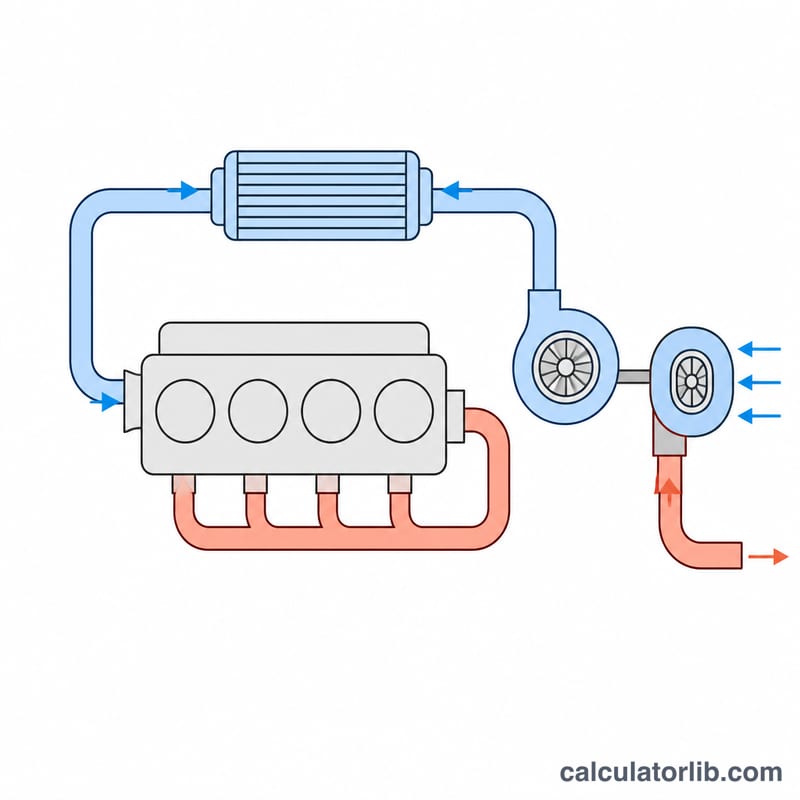
This calculator estimates how much extra horsepower a turbocharger adds to an engine for a given amount of boost pressure. Forced induction packs more air into each cylinder, and since power is roughly proportional to the mass of air burned, adding boost above atmospheric pressure increases output in a predictable way.
The Formula Explained
Standard sea-level atmospheric pressure is about \(14.7\) psi. A turbo raising manifold pressure by \(P_{\text{boost}}\) psi increases the absolute pressure to \(14.7 + P_{\text{boost}}\). The extra power is estimated as:
$$\text{HP}_{\text{gain}} = \text{HP}_{\text{NA}} \times \frac{P_{\text{boost}}}{14.7} \times \eta$$where \(\text{HP}_{\text{NA}}\) = naturally aspirated horsepower, \(P_{\text{boost}}\) = boost pressure in psi, and \(\eta\) = turbo efficiency (typically \(0.8\) to \(1.0\)) accounting for heat, backpressure, and volumetric losses. Total power is \(\text{HP}_{\text{total}} = \text{HP}_{\text{NA}} + \text{HP}_{\text{gain}}\).
How to Use It
Enter your engine's naturally aspirated horsepower, the boost pressure the turbo delivers, and an efficiency factor. The tool returns the estimated horsepower gain and the total boosted output.
Worked Example
A \(200\) HP engine running \(7.35\) psi of boost at full efficiency (\(\eta = 1.0\)):
$$\text{HP}_{\text{gain}} = 200 \times \frac{7.35}{14.7} \times 1.0 = 100$$The engine gains about \(100\) HP, for a total of roughly \(300\) HP.
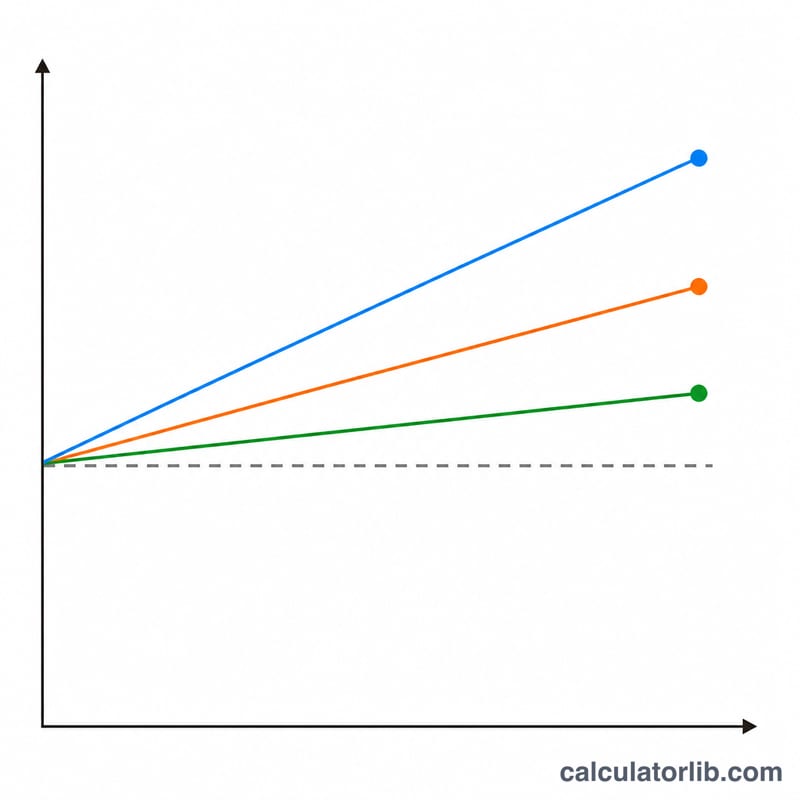
Boost & Power Scenarios Compared
The estimated power added by a turbocharger follows the article's formula:
$$\text{HP}_{\text{gain}} = \text{HP}_{\text{NA}} \times \frac{P_{\text{boost}}}{14.7} \times \eta$$
where \(\text{HP}_{\text{NA}}\) is naturally aspirated horsepower, \(P_{\text{boost}}\) is boost pressure in psi, 14.7 is the reference for one atmosphere at sea level (psi), and \(\eta\) is a turbo/efficiency factor. Total boosted power is \(\text{HP}_{\text{total}} = \text{HP}_{\text{NA}} + \text{HP}_{\text{gain}}\). The table below fixes \(\text{HP}_{\text{NA}} = 200\) and varies boost and efficiency so you can see how sensitive the result is to each input.
| Boost (psi) | Efficiency \(\eta\) | HP gain | HP total |
|---|---|---|---|
| 5 | 0.8 | 54.4 | 254.4 |
| 5 | 0.9 | 61.2 | 261.2 |
| 5 | 1.0 | 68.0 | 268.0 |
| 7.35 | 0.8 | 80.0 | 280.0 |
| 7.35 | 0.9 | 90.0 | 290.0 |
| 7.35 | 1.0 | 100.0 | 300.0 |
| 10 | 0.8 | 108.8 | 308.8 |
| 10 | 0.9 | 122.4 | 322.4 |
| 10 | 1.0 | 136.1 | 336.1 |
| 15 | 0.8 | 163.3 | 363.3 |
| 15 | 0.9 | 183.7 | 383.7 |
| 15 | 1.0 | 204.1 | 404.1 |
Worked example (200 HP, 7.35 psi, \(\eta = 1.0\)): \(\text{HP}_{\text{gain}} = 200 \times \frac{7.35}{14.7} \times 1.0 = 200 \times 0.5 \times 1.0 = 100\), giving a total of \(200 + 100 = 300\) HP. Because 7.35 psi is exactly half of 14.7, this represents roughly a 50% increase before efficiency losses. Note this is an idealized estimate; a lower \(\eta\) (heat, restriction, non-ideal charge) reduces the gain proportionally.
Typical Boost Pressure & Efficiency Ranges
The figures below are practical rules of thumb used in the automotive performance community, not fixed engineering standards, legal limits, or manufacturer specifications. Safe boost for any specific engine depends on its internals, fuel, compression ratio, and tuning, so treat these as rough orientation only.
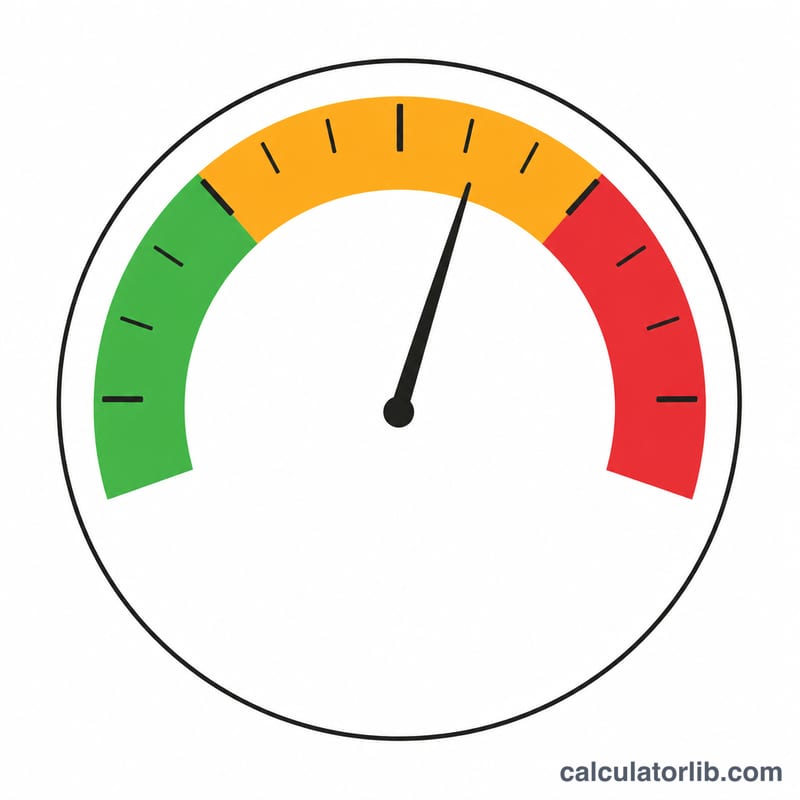
Boost pressure (psi, gauge, at sea level)
- Mild / street: about 5–8 psi. Modest, generally engine-friendly gains on many stock or lightly built engines.
- Performance: about 9–15 psi. Noticeably larger gains, typically requiring supporting fuel, cooling, and tuning.
- High-boost builds: 15–25+ psi. Usually reserved for forged internals and dedicated fuel/cooling systems; well beyond typical stock tolerances.
These pressures are gauge pressure above atmospheric. Because atmospheric pressure drops at altitude, the same absolute charge is achieved at slightly lower gauge boost at sea level than in the mountains; the 14.7 psi reference in the formula assumes sea-level conditions.
Efficiency factor \(\eta\)
- \(\eta \approx 0.8\): hot, restrictive, or poorly intercooled setups where charge temperature and flow losses eat into the theoretical gain.
- \(\eta \approx 0.9\): a reasonable typical value for a well-sorted street setup.
- \(\eta \approx 1.0\): an idealized, well-intercooled best case; real-world results usually fall a little short of this.
The efficiency factor is a lumped, simplified stand-in for many real effects (charge heating, intercooler performance, exhaust restriction, turbo sizing). It is a modeling convenience rather than a measured constant, so use conservative values when in doubt and validate real output on a dynamometer.
FAQ
Is this an exact figure? No. It is a first-order estimate; real gains depend on fuel, timing, intercooling, and the turbo map.
What efficiency should I use? Start near \(0.9\); use lower values for hot, restrictive setups and higher for well-intercooled builds.
Can I model twin turbos? Yes, just enter the combined boost pressure they produce at the manifold.