
What Is the Crop Profit Per Acre Calculator?
This calculator estimates the net profit you earn on each acre of a crop by comparing the money the crop brings in against the money you spend to grow it. It turns three simple numbers — expected yield, market price, and input cost — into a clear per-acre profit figure, plus gross revenue and profit margin. Farmers, agronomists, and landowners use it to compare crops, test price scenarios, and decide how to allocate land.
The Formula Explained
Profit per acre is gross revenue minus total input cost:
$$\text{Profit} = (\text{Yield} \times \text{Price}) - \text{Cost}$$where \(\text{Yield}\) = units harvested per acre (bushels, tons, or bales), \(\text{Price}\) = market price per unit, and \(\text{Cost}\) = all input costs per acre such as seed, fertilizer, chemicals, fuel, and labor. Profit margin shows how much of each revenue dollar you keep:
$$\text{Margin} = \frac{\text{Profit}}{\text{Yield} \times \text{Price}} \times 100$$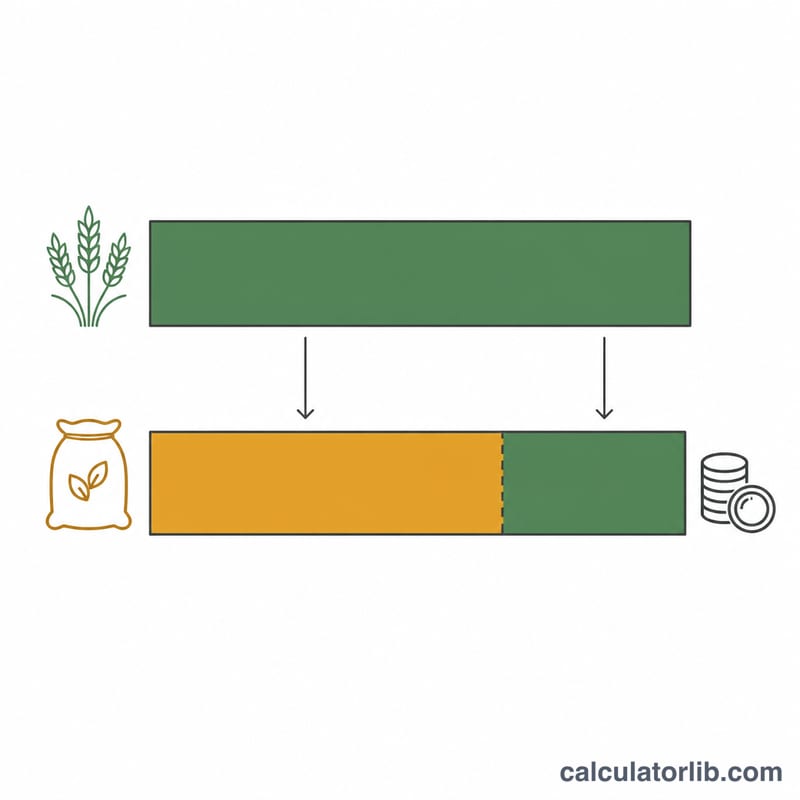
How to Use It
Enter your realistic yield per acre, the price you expect to receive per unit, and your total input cost per acre. The tool multiplies yield by price to get gross revenue, subtracts your cost, and reports net profit and margin. Try a low, expected, and high price to build a simple risk range before planting.
Worked Example
Suppose corn yields 180 bushels per acre at a market price of $4.50 per bushel, with input costs of $520 per acre. Gross revenue is:
$$180 \times \$4.50 = \$810$$Subtracting cost gives the net profit per acre:
$$\$810 - \$520 = \$290$$The profit margin is \(\tfrac{290}{810}\times 100 \approx 35.8\%\).
Scenario Comparison: Profit Across Yields and Prices
The table below runs the calculator's formula on typical US field-crop scenarios. It uses bushels per acre and US dollars per acre. Yields, prices and costs are rounded examples for comparison only. They are not forecasts or official averages. Your own costs depend on region, rent, inputs and how you farm. In each row, gross revenue is \(\text{Yield} \times \text{Price}\), net profit is gross revenue minus cost per acre, and margin is \(\text{Net profit} \div \text{Gross revenue} \times 100\).
| Crop / scenario | Yield (bu/acre) | Price ($/bu) | Cost ($/acre) | Gross revenue ($/acre) | Net profit ($/acre) | Margin |
|---|---|---|---|---|---|---|
| Corn – low price | 180 | 3.80 | 520 | 684.00 | 164.00 | 24.0% |
| Corn – mid price | 180 | 4.50 | 520 | 810.00 | 290.00 | 35.8% |
| Corn – high price | 180 | 5.20 | 520 | 936.00 | 416.00 | 44.4% |
| Corn – reduced yield, low price | 150 | 3.80 | 520 | 570.00 | 50.00 | 8.8% |
| Corn – drought yield, low price | 120 | 3.80 | 520 | 456.00 | −64.00 | −14.0% |
| Soybeans – low price | 55 | 11.00 | 430 | 605.00 | 175.00 | 28.9% |
| Soybeans – high price | 55 | 13.00 | 430 | 715.00 | 285.00 | 39.9% |
| Wheat – low price | 70 | 6.00 | 300 | 420.00 | 120.00 | 28.6% |
| Wheat – high price | 70 | 7.00 | 300 | 490.00 | 190.00 | 38.8% |
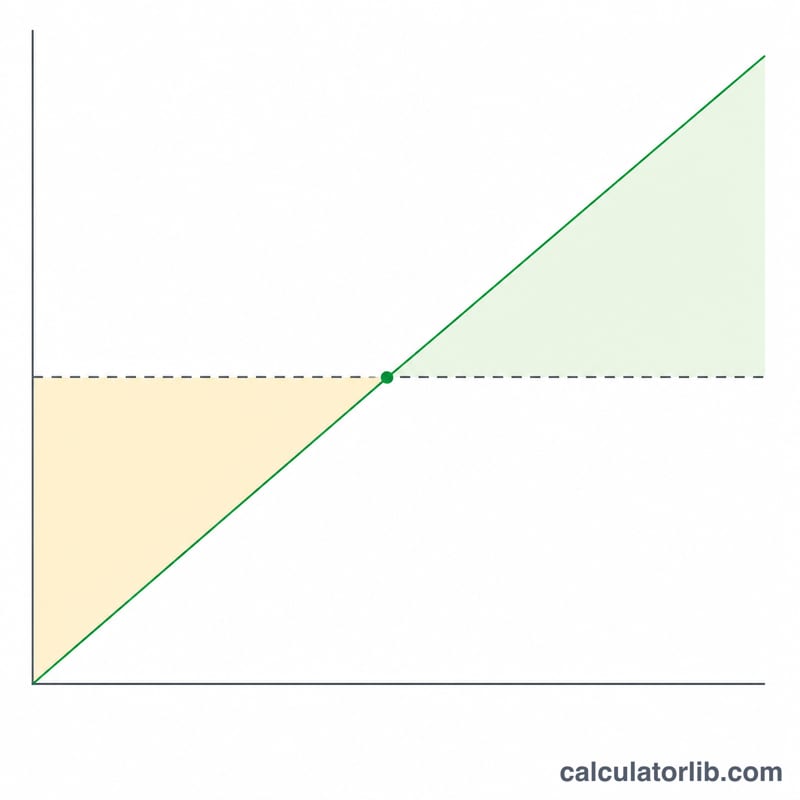
Where break-even falls. Profit is zero when gross revenue equals cost. So the break-even price is \(\text{Cost} \div \text{Yield}\), and the break-even yield is \(\text{Cost} \div \text{Price}\). For the scenarios above:
- Corn at 180 bu/acre and $520/acre: break-even price \(= 520 \div 180 \approx \$2.89\) per bushel. At $3.80, the break-even yield is \(520 \div 3.80 \approx 136.8\) bu/acre. This is why the 120 bu/acre drought row loses money.
- Soybeans at 55 bu/acre and $430/acre: break-even price \(= 430 \div 55 \approx \$7.82\) per bushel.
- Wheat at 70 bu/acre and $300/acre: break-even price \(= 300 \div 70 \approx \$4.29\) per bushel.
Look at the corn rows. A $0.70/bu price change at a fixed 180 bu/acre moves profit by \(180 \times 0.70 = \$126\) per acre. A 30 bu/acre yield loss at $3.80 costs \(30 \times 3.80 = \$114\) per acre. Price and yield risk can each move profit by similar amounts, so test both.
More Worked Examples
Each example below uses the same three steps:
- Multiply yield by price to get gross revenue.
- Subtract cost per acre to get net profit.
- Divide net profit by gross revenue to get the margin.
The figures are illustrative US-style numbers, not market quotes. The key rule is that yield and price must use the same unit (bushels with $/bushel, tons with $/ton, bales with $/bale).
Example 1: Soybeans with a healthy margin
Inputs: 60 bu/acre, $12.00 per bushel, $450 per acre total cost.
$$\text{Gross revenue} = 60 \times \$12.00 = \$720.00$$$$\text{Net profit} = \$720.00 - \$450.00 = \$270.00$$$$\text{Margin} = \frac{270}{720} \times 100 = 37.5\%$$Net profit is 270 dollars per acre. The break-even price is \(450 \div 60 = \$7.50\) per bushel, which gives a wide cushion against falling prices.
Example 2: Hay in tons or bales (unit consistency)
Inputs: 4 tons/acre (all cuttings combined), $180 per ton, $400 per acre cost.
$$\text{Gross revenue} = 4 \times \$180 = \$720$$$$\text{Net profit} = \$720 - \$400 = \$320$$$$\text{Margin} = \frac{320}{720} \times 100 \approx 44.4\%$$Net profit is 320 dollars per acre.
The same hay sold in 1,000 lb bales gives the same result. Using US short tons of 2,000 lb, 4 tons = 8,000 lb = 8 bales. $180 per ton is $90 per bale, so \(8 \times \$90 = \$720\) in revenue, the same as before. Problems start when units are mixed. Entering 4 (tons) with $90 (per bale) would show only \(4 \times 90 = \$360\) in revenue and a false loss of \(-\$40\). Bale weights vary widely, so convert using your actual average bale weight.
Example 3: Negative profit when costs exceed revenue
Inputs: corn at 140 bu/acre after a dry season, $4.00 per bushel, $600 per acre cost (for example, high cash rent plus fertilizer).
$$\text{Gross revenue} = 140 \times \$4.00 = \$560.00$$$$\text{Net profit} = \$560.00 - \$600.00 = -\$40.00$$$$\text{Margin} = \frac{-40}{560} \times 100 \approx -7.1\%$$The field loses $40 per acre. To break even, you would need one of the following:
- A yield of \(600 \div 4.00 = 150\) bu/acre at the same price.
- A price of \(600 \div 140 \approx \$4.29\) per bushel at the same yield.
- A cost cut of $40 per acre.
Before deciding whether to plant, change inputs or market the crop differently, check which of these three levers you can realistically move. This is general information, not professional financial or agronomic advice.
FAQ
What costs should I include? Include every variable input cost per acre — seed, fertilizer, crop protection, fuel, custom work, and labor. For a fuller picture, add fixed costs like land rent and equipment.
Why is my profit negative? A negative result means input costs exceed revenue at the yield and price you entered. Lower costs or a higher yield or price are needed to break even.
Can I use any crop unit? Yes. Just keep the yield unit and the price unit consistent — bushels with price per bushel, or tons with price per ton.