What this calculator tells you
Give it an air temperature and a wind speed, and it returns three things: the wind chill — the temperature that still air would have to be for your exposed skin to lose heat at the same rate — printed in °C, °F and K at once; the equivalent heat loss from bare skin in watts per square metre; and, when it is cold enough to matter, how long exposed skin can last before frostbite.
People reach for it when the thermometer alone is not the whole story: whether a child's walk to school needs a face covering, whether this morning's run is safe, how long a crew can work on an exposed site. The frostbite line is the part most users actually came for.
How to read the inputs
Two numbers and two unit selectors. Both readings should describe the same moment and place — a forecast page, an airport METAR or a home weather station gives you both.
| Input | Where the value comes from | Sensible range |
|---|---|---|
| Wind speed | The sustained wind, not the gust — forecasts quote sustained speed by default. | 0 to about 100 km/h (60 mph) covers nearly all real weather. There is no upper limit. |
| Wind speed unit | Whatever your source uses: mph, km/h, knots (marine and aviation) or m/s. | Changes nothing but the conversion. |
| Air temperature | The shade air temperature — not a sun-exposed thermometer, and not a "feels like" figure, which would double-count the wind. | Accepted only from −50 °F to 50 °F: −45.6 °C to 10 °C, or 227.6 K to 283.15 K. |
| Temperature unit | Your choice. It decides which scale is printed first — and how your digits are checked against the band above. | — |
Wind speed must be zero or positive; a blank field is refused outright, which is not the same as entering 0. An explicit 0 is accepted and computes a result.
The formulas
Everything is worked out internally in Fahrenheit and miles per hour, whatever units you type. The wind chill is the 2001 US National Weather Service equation, with \(T_F\) = air temperature in °F and \(V\) = wind speed in mph:
$$T_{\text{wc}} = 35.74 + 0.6215\,T_F - 35.75\,V^{0.16} + 0.4275\,T_F\,V^{0.16}$$The Celsius and Kelvin figures are conversions of that same unrounded result, each rounded to a whole number on its own.
The heat-loss line is a much older index (Siple–Passel, 1945) with \(v\) = wind speed in m/s and \(T_C\) = air temperature in °C, against an assumed skin temperature of 33 °C:
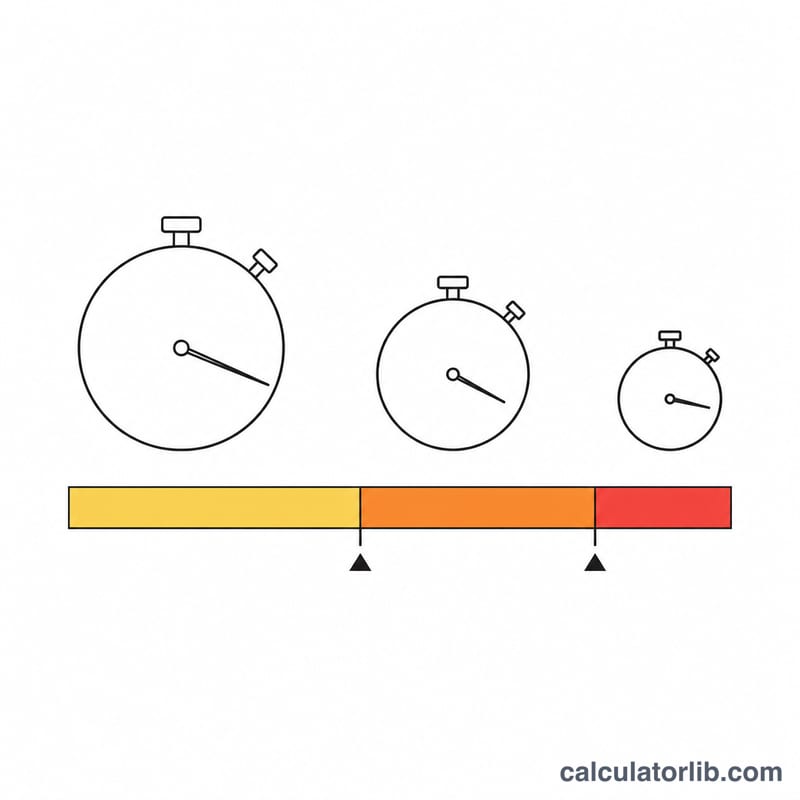
$$H = \left(11.6222\sqrt{v} + 12.1452 - 1.16222\,v\right)\times\left(33 - T_C\right)$$The frostbite line uses the wind chill risk bands published by Environment and Climate Change Canada, applied to the wind chill rounded to a whole °C: −28 to −39 high risk, exposed skin can freeze in 10 to 30 minutes; −40 to −47 very high risk, 5 to 10 minutes; −48 to −54 severe risk, 2 to 5 minutes; −55 or colder extreme risk, less than 2 minutes. From −10 to −27 the risk is moderate and above that it is low, so no freeze time is shown.
Worked example: 25 km/h at −15 °C
A cold, breezy winter morning. Convert first:
$$T_F = -15 \times 1.8 + 32 = 5\,{}^\circ\text{F}$$ $$V = 25 \times 0.621371 = 15.5343\ \text{mph} \qquad v = \frac{15.5343}{2.236936} = 6.9444\ \text{m/s}$$Raise the wind to the 0.16 power, then run the wind chill equation:
$$V^{0.16} = 15.5343^{\,0.16} = 1.550981$$ $$T_{\text{wc}} = 35.74 + 3.1075 - 55.4476 + 3.3152 = -13.2849\,{}^\circ\text{F}$$Convert that one unrounded number to the other two scales, rounding each separately:
$$\frac{-13.2849 - 32}{1.8} = -25.1583\,{}^\circ\text{C} \qquad -25.1583 + 273.15 = 247.9917\ \text{K}$$So it feels like −25 °C, or −13 °F, or 248 K. Now the heat loss, driven by the air temperature of −15 °C:
$$H = \left(11.6222 \times 2.63523 + 12.1452 - 1.16222 \times 6.9444\right) \times 48$$ $$H = 34.7014 \times 48 = 1665.67 \rightarrow 1{,}666\ \text{W/m}^2$$Finally frostbite: the rounded wind chill of −25 °C sits in the Canadian moderate band (−10 to −27), so no freeze time is shown. Three degrees colder, at −28 °C, the result would switch to high risk: exposed skin can freeze in 10 to 30 minutes.
Rules that surprise people
Light wind gives a "chill" warmer than the air. The equation was validated for winds of about 3 mph (5 km/h) and up, and there is no guard below that. At 0 km/h and 10 °C the calculator reports a wind chill of 19 °C; at 0 km/h and −45 °C it reports −15 °C, thirty degrees warmer than the air. Below about 5 km/h, ignore the chill figure and use the air temperature.
The accepted temperature band is fixed in Fahrenheit, so the same digits can pass or fail depending on the unit you picked. The limit is −50 °F to 50 °F, inclusive. Entering 10 as °C is exactly 50 °F and is accepted; 10.1 as °C is 50.18 °F and is refused — while 10.1 as °F sails through. If a plausible winter temperature is rejected, check the unit selector before your typing.
Heat loss follows the air temperature, not the wind chill — and it falls in a gale. Its wind term peaks at 25 m/s (90 km/h, 56 mph) and declines after that. At −20 °C, 90 km/h gives 2,184 W/m² but 160 km/h gives only 2,013 W/m²; past roughly 430 km/h it goes negative. Real weather never reaches the far side of that curve, but the watt figure is not a simple "more wind is worse" ranking.
Common questions
Why do the °C, °F and K figures not convert into each other exactly?
All three come from a single unrounded result, each rounded to a whole number independently. Near a rounding boundary the three scales tick over at slightly different wind speeds, so a printed figure can sit one degree away from a hand conversion. All three are correct roundings of the same underlying value.
Should I enter the gust speed or the sustained wind?
The sustained wind. Wind chill describes steady heat loss over minutes of exposure; gusts are brief. Running the gust figure gives a worst-case bound, but the sustained value is what the index was built for.
Why does it refuse temperatures above 10 °C?
The equation is only defined up to 50 °F (10 °C). Above that, wind cools you mainly by evaporation rather than by the mechanism modelled here, so the calculator declines instead of printing a misleading number.
Does the frostbite time apply to me?
Not exactly. It describes bare, dry skin on an average adult — cheeks, nose and ears. Wet skin freezes faster, and children, older people and anyone with reduced circulation have less margin. Use it to decide what to cover, not as a countdown you can spend.
Why does changing a unit dropdown not change the numbers?
The units are converted before anything is calculated. 36 km/h, 10 m/s and 19.44 knots at −20 °C all give the same −34 °C and 1,976 W/m². The temperature selector only decides which scale leads the headline.
Interpreting Your Wind Chill Result
What the number actually means
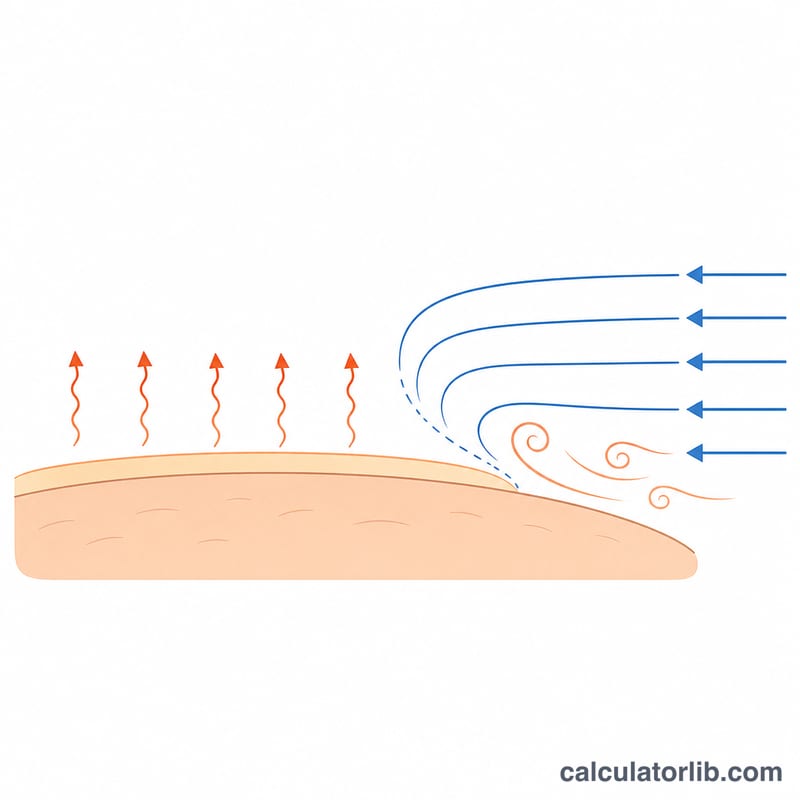
Wind chill is an equivalent still-air temperature: the temperature that, with only a light 3 mph (5 km/h) walking breeze, would strip heat from bare human skin at the same rate as your actual temperature-and-wind combination. It is a physiological index, not a measurement. Three consequences follow:
- No thermometer will ever read the wind chill value. The air is still at the temperature you entered.
- Wind chill does not act on objects. Water pipes, engine blocks, parked vehicles and stored liquids cannot be cooled below the true air temperature by wind — wind only makes them reach that air temperature faster.
- It is defined for a bare human face. Clothed skin, wet skin, or skin behind a windbreak experiences something quite different.
Official hazard thresholds
In the United States, the NWS historically issued a Wind Chill Advisory and a Wind Chill Warning, with the trigger values set locally by each Weather Forecast Office — commonly in the range of about −15 °F to −25 °F wind chill for an advisory and roughly −25 °F to −35 °F or colder for a warning, with much higher (less cold) triggers in the southern states. Under the NWS hazard-simplification changes introduced for the 2024–25 winter season these products were renamed Cold Weather Advisory and Extreme Cold Watch/Warning; the underlying locally-set thresholds still vary by region, so always check your local office rather than assuming a national number.
Environment and Climate Change Canada publishes fixed wind chill risk bands in °C:
| Wind chill (°C) | Canadian hazard band |
|---|---|
| 0 to −9 | Low risk: slight increase in discomfort |
| −10 to −27 | Moderate risk: discomfort; frostbite and hypothermia possible after long periods outdoors without adequate protection |
| −28 to −39 | High risk: exposed skin can freeze in 10 to 30 minutes |
| −40 to −47 | Very high risk: exposed skin can freeze in 5 to 10 minutes |
| −48 to −54 | Severe risk: exposed skin can freeze in 2 to 5 minutes |
| −55 and colder | Extreme risk: exposed skin can freeze in less than 2 minutes |
Other countries use their own indices — Australia and much of Europe often prefer apparent temperature or UTCI instead — so a wind chill figure alone is not an international hazard standard.
Reading the frostbite time
The frostbite line is the Environment and Climate Change Canada risk band for your wind chill. Its freeze times describe dry, bare skin on a healthy adult — in practice the cheeks, nose, ears and fingers. In sustained winds over 50 km/h frostbite can occur faster than indicated; wet skin freezes faster, and children, older adults, people on certain medications and anyone with impaired circulation have less margin. Treat it as a planning band, not a countdown timer.
Reading the Siple–Passel heat-loss output
The heat-loss figure is the classic Siple–Passel wind chill index, an estimate of the heat flux from a surface held at 33 °C. The tool displays it in W/m². As an index, the conventional reading is:
| Index value (W/m²) | Descriptive label |
|---|---|
| below 1400 | Cool |
| 1400 – 2000 | Very cold |
| above 2000 | Bitter; the exposed-flesh-freezing range |
These are index descriptors, not medical categories, and not a prediction about any individual. Note also that Siple and Passel's original 1945 tables were published in kcal/m²/h, so historic threshold numbers quoted in that unit will not line up numerically with a W/m² display (1 kcal/m²/h ≈ 1.163 W/m²).
This section is general information about how a weather index is defined and is not professional, medical or safety advice; for cold-exposure decisions follow your national weather service and local emergency guidance.
Sources
- National Weather Service (NOAA) — Wind Chill Chart and formula, effective 1 November 2001
- National Weather Service, El Paso WFO — Wind Chill calculation (°F/mph formula and W/m² heat-loss formula)
- Environment and Climate Change Canada — Wind chill and the Wind Chill Index (risk levels and freeze times)
See also: Wind Chill Calculator — the feels-like temperature on its own, in °F or °C.