What this calculator does
This calculator runs an F-test for the equality of two population variances. Paste two raw samples and it computes each sample variance, the F statistic, both degrees of freedom, the critical value or values at your significance level, a p-value, and a reject or do-not-reject decision. It suits students, analysts and engineers who need to check whether two processes, instruments or groups show the same spread before choosing a follow-up method such as a pooled or Welch t-test.
How to use it
Enter the inputs in this order:
- Sample 1 data: at least two numbers separated by commas, semicolons, spaces or new lines, with a period as the decimal mark.
- Sample 2 data: entered the same way.
- Alternative hypothesis: two-sided (variances not equal), greater (variance 1 larger), or less (variance 1 smaller).
- Significance level alpha: a value such as 0.05, which must be above 0 and below 0.5.
Sample 1 is always the numerator of the ratio, so the order of the samples matters for one-sided tests.
The formula
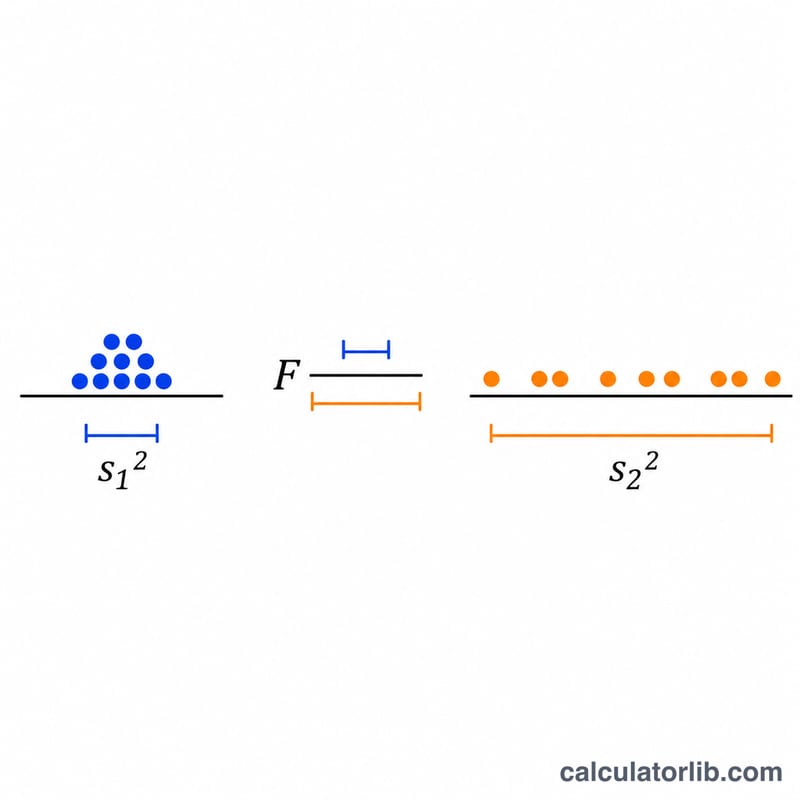
$$F = \frac{s_1^2}{s_2^2}, \qquad s^2 = \frac{1}{N-1}\sum_{i=1}^{N}(x_i-\bar{x})^2$$
Here \(s_1^2\) and \(s_2^2\) are the sample variances, \(x_i\) are the observations, \(\bar{x}\) is the sample mean and \(N\) is the sample size. The statistic follows an F distribution with \(N_1-1\) numerator and \(N_2-1\) denominator degrees of freedom when the null hypothesis holds and the data are normal.
Conventions and assumptions
- Variances use the divisor \(n-1\), and sample 1 is the numerator.
- Degrees of freedom are \(N_1-1\) and \(N_2-1\).
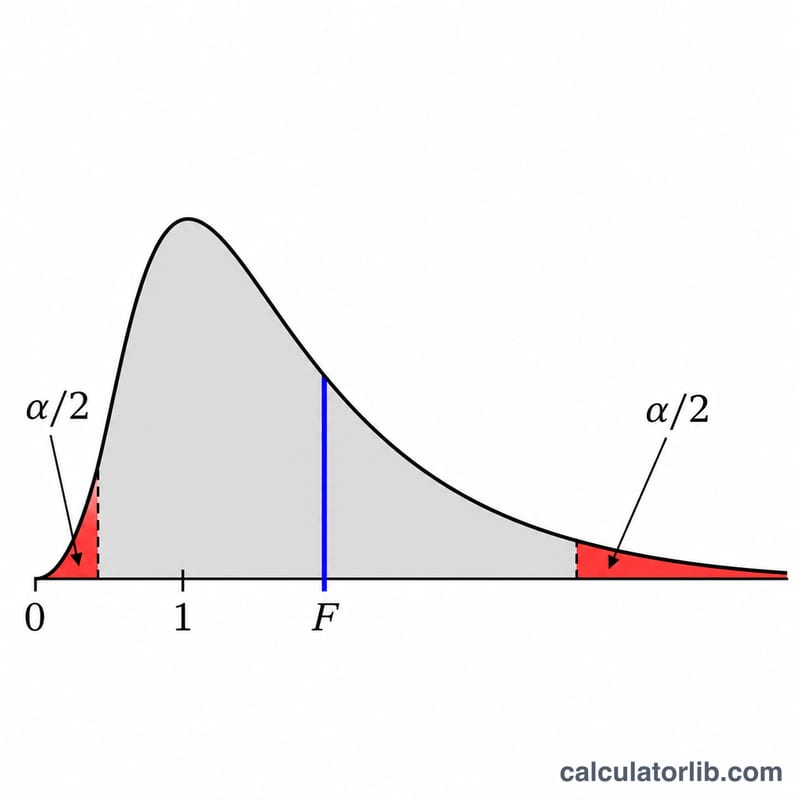
- Upper alternative: reject if \(F\) exceeds the \(1-\alpha\) quantile. Lower alternative: reject if \(F\) is below the \(\alpha\) quantile. Two-sided: reject if \(F\) is below the \(\alpha/2\) quantile or above the \(1-\alpha/2\) quantile.
- Inequalities are strict, so an F exactly equal to a critical value does not reject.
- The p-value is the upper tail for the greater alternative and the lower tail for the less alternative. For the two-sided test it is \(\min(1, 2\min(p_{\text{lower}}, p_{\text{upper}}))\). The method follows the NIST critical regions, but the NIST page prints no p-value formula, so this doubled-tail rule is a design choice consistent with those regions. Reject exactly when \(p<\alpha\).
- No ranks, ties or continuity corrections apply, because the test is parametric.
- The test assumes independent samples from normal populations and is sensitive to departures from normality.
- Results are computed at full precision and displayed to about 4 to 6 significant digits.
Worked example
Sample 1 is 12.1, 13.4, 11.8, 14.2, 12.9, 13.7, 12.5, 14.8 (n = 8). Sample 2 is 12.4, 12.8, 12.2, 13.0, 12.6, 12.9, 12.5 (n = 7). The test is two-sided with \(\alpha = 0.05\).
$$s_1^2 = 1.0850,\quad s_2^2 = 0.082381$$
$$F = \frac{1.0850}{0.082381} = 13.1705,\quad df_1 = 7,\ df_2 = 6$$
The critical values are 0.1954 (lower) and 5.6955 (upper). Since \(13.1705 > 5.6955\), the null hypothesis is rejected. The p-value is 0.005860, which is below 0.05 and confirms the decision.
Reading the result and limitations
An F far above 1 means sample 1 is more spread out than sample 2; an F near 0 means the opposite. A small p-value is evidence against equal variances. A large one means the data do not show a difference, which is not proof of equality, especially with small samples. The F-test is much less robust than Levene or Brown-Forsythe tests when data are skewed or heavy-tailed, so check normality first. A sample with zero variance in sample 2 makes F undefined.
FAQ
What does a significant result mean?
The p-value is below alpha, so the observed variance ratio would be unlikely if both populations had the same variance.
Does the order of the samples matter?
Swapping the samples gives \(1/F\) and swaps the one-sided alternatives. The two-sided decision stays the same.
Why is the two-sided p-value doubled?
The two-sided test splits alpha equally between both tails, so the smaller tail probability is doubled and capped at 1.
How many observations are needed?
At least two per sample, though small samples give little power to detect real differences.
What if my data are not normal?
The F-test can give misleading results. Consider a more robust test such as Levene.
Sources
- 1.3.5.9. F-Test for Equality of Two Variances, NIST/SEMATECH e-Handbook of Statistical Methods.