What the runs test calculator does
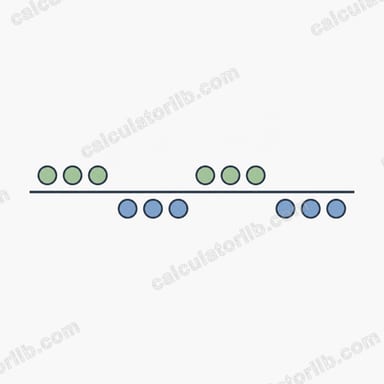
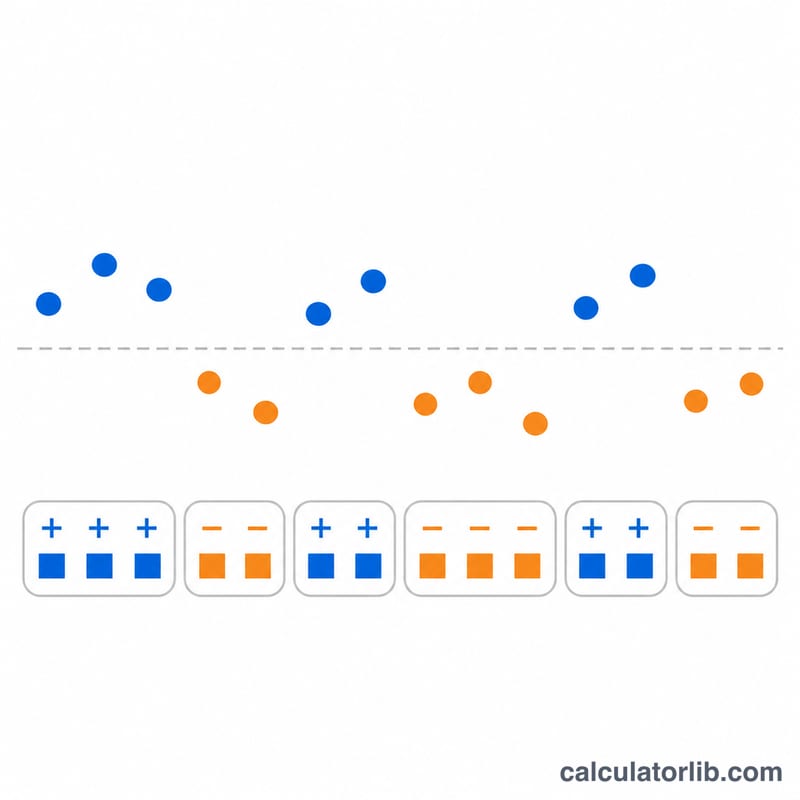
This calculator applies the runs test for detecting non-randomness to an ordered sequence of numbers. Each value is coded as above (+) or below (-) the median, the runs in that pattern are counted, and the count is compared with what a random ordering would produce. It returns the number of runs, the expected number, the standard deviation, the Z statistic, a two-sided p-value and a reject or do-not-reject decision. It suits analysts checking residuals, process measurements or any time-ordered series for trends, clustering or oscillation.
How to use it
Enter the values in time order in the data field, separated by commas, semicolons, spaces or new lines, with a dot as the decimal separator. Then choose the two-sided significance level alpha (0.10, 0.05, 0.025 or 0.01). The order matters because the data are never sorted. At least two numeric values are needed, and at least one value must lie above and one below the median.
The formula
A run is a series of consecutive values with the same sign. With \(R\) observed runs, the test statistic is:
$$Z = \frac{R - \bar{R}}{s_R}$$The expected runs and variance under the hypothesis of randomness are:
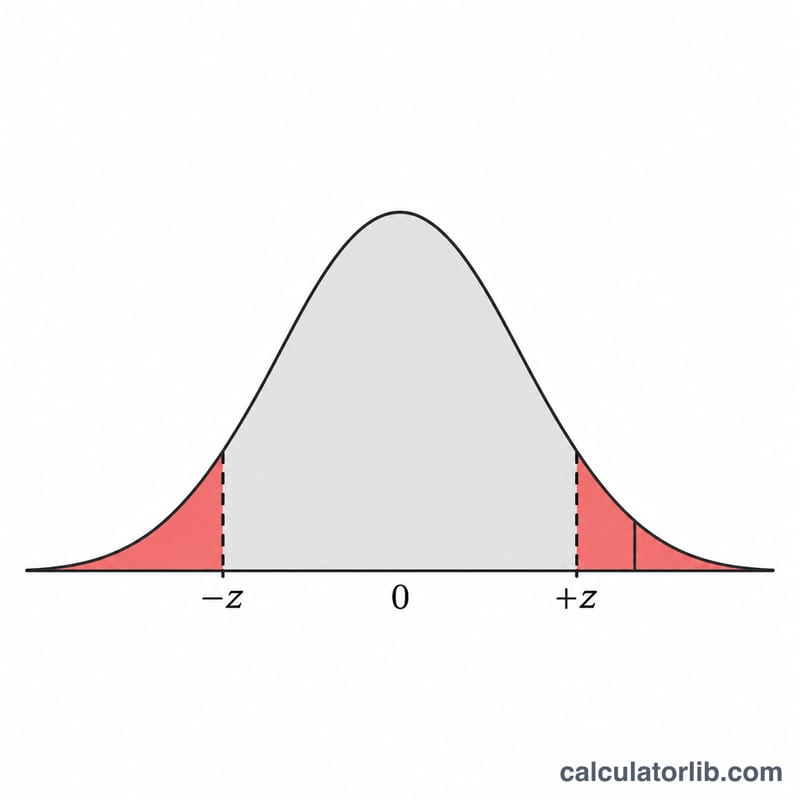
$$\bar{R} = \frac{2 n_1 n_2}{n_1 + n_2} + 1$$$$s_R^2 = \frac{2 n_1 n_2(2 n_1 n_2 - n_1 - n_2)}{(n_1+n_2)^2 (n_1+n_2-1)}$$Here \(n_1\) is the count of values above the median, \(n_2\) the count below, \(R\) the observed runs, \(\bar{R}\) the expected runs and \(s_R\) the standard deviation of runs. The two-sided p-value is \(p = 2(1-\Phi(|Z|))\), where \(\Phi\) is the standard normal CDF. Randomness is rejected when \(|Z| > z_{1-\alpha/2}\).
Conventions and assumptions
- Values above the median are positive and values below are negative; a run is a block of consecutive values with the same sign.
- The source does not say how to treat values equal to the median. As a design choice, they are omitted, the order of the rest is kept, and the omitted count is reported. \(n_1\) and \(n_2\) count only positive and negative values.
- The median is the standard sample median of all entered values: the middle value for odd counts, the mean of the two middle values for even counts.
- No continuity correction is applied.
- The decision is strict: equality of \(|Z|\) and the critical value does not reject. The 5% critical value is 1.96.
- The normal approximation is always used. A small-sample warning appears when \(n_1 \le 10\) or \(n_2 \le 10\), because exact tables are not implemented.
- Statistics and the p-value are displayed to 4 decimal places; internal values are unrounded.
Worked example
The default 20-value sequence has median 3.95, with no values equal to it. Ten values are above and ten below, so \(n_1 = 10\), \(n_2 = 10\), and the sequence has \(R = 14\) runs.
$$\bar{R} = \frac{2 \times 10 \times 10}{20} + 1 = 11$$The standard deviation of runs is \(s_R = 2.1764\), so:
$$Z = \frac{14 - 11}{2.1764} = 1.3784$$The two-sided p-value is 0.1681 and the critical value at \(\alpha = 0.05\) is 1.9600. Since \(1.3784 < 1.9600\), randomness is not rejected. Because \(n_1 \le 10\), the small-sample warning is on.
Reading the result and limitations
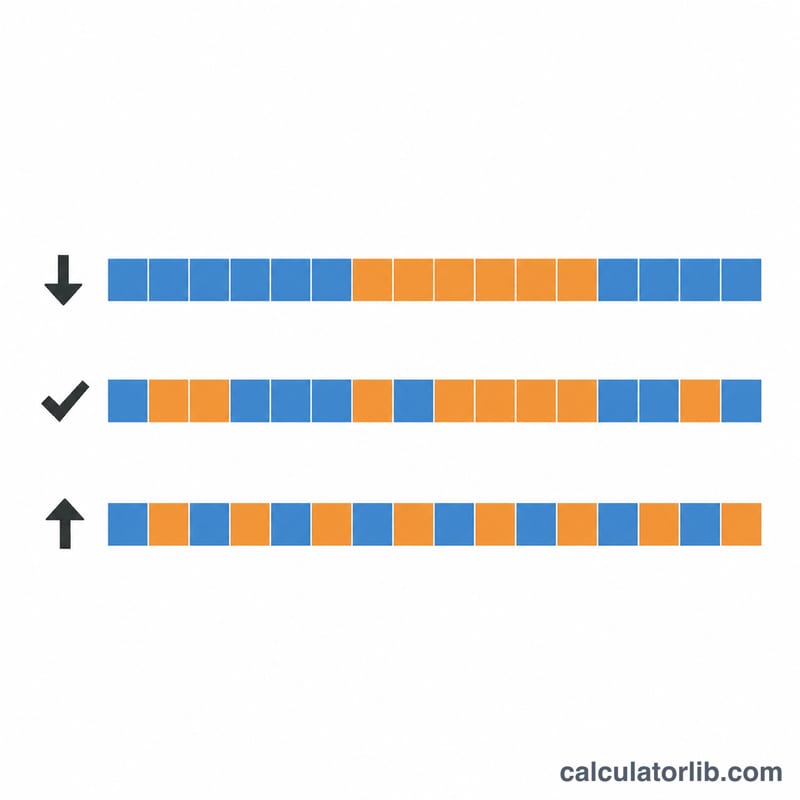
Too few runs suggest clustering or a trend; too many suggest alternation. A large \(|Z|\) and a p-value below alpha indicate non-randomness. Failing to reject does not prove randomness, only that this test found no evidence against it. The median split is insensitive to some patterns, such as slow changes in spread. With small groups the normal approximation can be inaccurate, so treat borderline results cautiously.
FAQ
What does the runs test check?
It checks whether the order of values looks random, based on how often the sequence switches between above-median and below-median values.
How are values equal to the median handled?
They are dropped from the sequence, and the number dropped is reported. The remaining values keep their order.
Why is there a small-sample warning?
The normal approximation works best when both \(n_1\) and \(n_2\) exceed 10. Below that, exact tables would be preferable and are not included.
Does the order of the data matter?
Yes. The data are used exactly as entered, and reordering changes the number of runs.
When is randomness rejected?
When \(|Z|\) is strictly greater than the normal critical value for the chosen alpha, equivalent to the p-value being below alpha.
Sources
- 1.3.5.13. Runs Test for Detecting Non-randomness, NIST/SEMATECH e-Handbook of Statistical Methods