What is an Inflation Calculator?
An inflation calculator is a financial tool that helps you understand how the purchasing power of money changes over time due to inflation. It allows you to compare the value of money between different years, showing how much more or less your money is worth as prices rise.
When to Use an Inflation Calculator
An inflation calculator is useful in several scenarios:
- Planning for retirement by estimating how much your savings will be worth in the future
- Evaluating the real return on investments after accounting for inflation
- Comparing historical prices and wages to their current equivalent values
How to Calculate Inflation
To calculate the future value of money affected by inflation, the following formula is used:
FV = PV × (1 + r)n
Where:
- FV = Future Value
- PV = Present Value (or starting value)
- r = Annual inflation rate (as a decimal)
- n = Number of years
The total change in value can be calculated as:
Total Change = Future Value - Present Value
The percentage change is:
Percentage Change = (Total Change / Present Value) × 100%
Inflation Calculator Examples
Example 1: Calculating Future Value with Inflation
How much will $10,000 be worth in 10 years with an annual inflation rate of 3%?
| Starting Value | Start Year | End Year | Inflation Rate | Result |
|---|---|---|---|---|
| $10,000 | 2023 | 2033 | 3% | $13,439.16 |
This means that you would need $13,439.16 in 2033 to have the same purchasing power as $10,000 in 2023, representing a 34.39% increase due to inflation.
Example 2: Calculating the Effect of High Inflation
How would $5,000 be affected over 5 years with a high inflation rate of 7%?
| Starting Value | Start Year | End Year | Inflation Rate | Result |
|---|---|---|---|---|
| $5,000 | 2023 | 2028 | 7% | $7,012.76 |
Your $5,000 would need to grow to $7,012.76 over 5 years to maintain the same purchasing power, representing a 40.26% total change.
Example 3: Comparing Historical Values
What would be the equivalent value of $1,000 from 2000 in 2023, assuming an average inflation rate of 2.5%?
| Starting Value | Start Year | End Year | Inflation Rate | Result |
|---|---|---|---|---|
| $1,000 | 2000 | 2023 | 2.5% | $1,769.67 |
$1,000 in 2000 would have the same purchasing power as $1,769.67 in 2023, showing a 76.97% increase in the amount needed to maintain equivalent value.
Effects of Inflation Over Time
Inflation's impact compounds over time and can significantly erode purchasing power. Even seemingly low inflation rates of 2-3% can substantially reduce the value of money over decades.
| Years | 2% Inflation | 3% Inflation | 5% Inflation | 7% Inflation |
|---|---|---|---|---|
| 5 | $1,104.08 | $1,159.27 | $1,276.28 | $1,402.55 |
| 10 | $1,218.99 | $1,343.92 | $1,628.89 | $1,967.15 |
| 20 | $1,485.95 | $1,806.11 | $2,653.30 | $3,869.68 |
| 30 | $1,811.36 | $2,427.26 | $4,321.94 | $7,612.26 |
Historical U.S. Inflation Rates by Year
The table below shows the average annual U.S. inflation rate measured by the Consumer Price Index for All Urban Consumers (CPI-U), as published by the U.S. Bureau of Labor Statistics (BLS). Figures represent the year-over-year change in the annual average CPI and are rounded to one decimal place.
| Year | Annual CPI Inflation | Notes |
|---|---|---|
| 1974 | 11.0% | Oil embargo era |
| 1979 | 11.3% | Second oil shock |
| 1980 | 13.5% | Postwar peak |
| 1981 | 10.3% | High interest-rate response |
| 1990 | 5.4% | Gulf War oil spike |
| 2000 | 3.4% | — |
| 2008 | 3.8% | Pre-recession commodity spike |
| 2009 | -0.4% | Deflation during recession |
| 2015 | 0.1% | Low-energy-price year |
| 2020 | 1.2% | Pandemic onset |
| 2021 | 4.7% | Post-pandemic surge begins |
| 2022 | 8.0% | Highest since 1981 |
| 2023 | 4.1% | Cooling from peak |
Over the long run, U.S. CPI inflation has averaged roughly 3% to 3.3% per year since the mid-20th century, though individual years vary widely. The 1970s and early 1980s mark the most sustained high-inflation period in modern U.S. history, while the 2010s were notable for unusually low inflation.
Key Inflation Terms Explained
- Inflation rate — The percentage increase in the general price level over a period, usually one year. A 3% annual rate means prices are, on average, 3% higher than a year earlier.
- Consumer Price Index (CPI) — A BLS index that tracks the average price of a fixed basket of consumer goods and services over time. Inflation rates are commonly derived from changes in the CPI.
- Purchasing power — The quantity of goods and services that a unit of currency can buy. Inflation erodes purchasing power, so the same dollar buys less over time.
- Nominal value — An amount expressed in current dollars, not adjusted for inflation (the face value).
- Real value — An amount adjusted for inflation, expressed in the constant purchasing power of a reference year, allowing fair comparison across time.
- Cumulative inflation — The total compounded price increase over an entire span of years, rather than the rate for a single year.
- Compounding — The process by which each year's inflation applies on top of the already-inflated price level, so the effect grows geometrically rather than by simple addition.
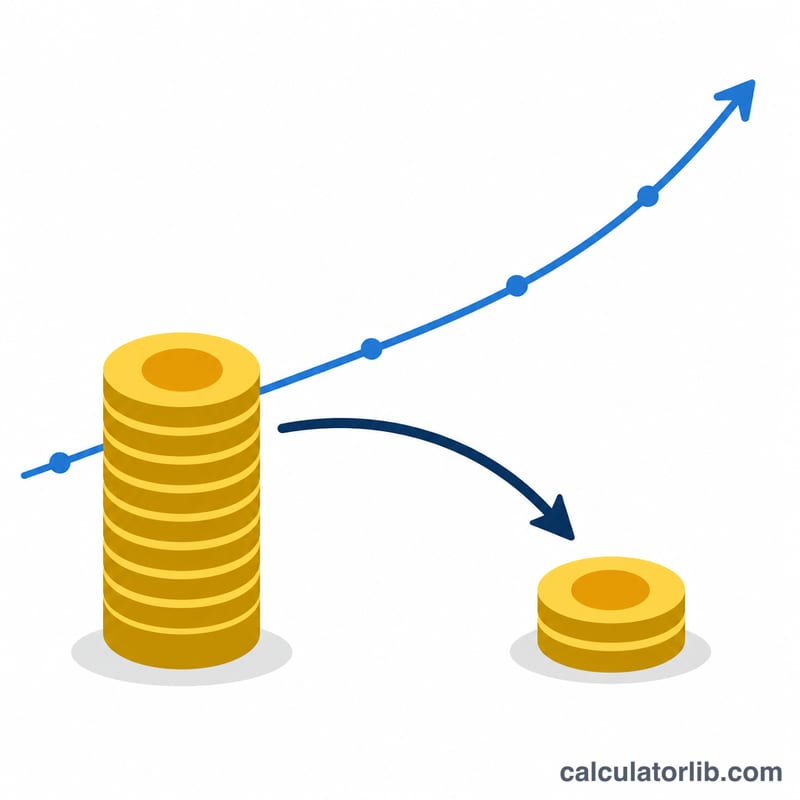
Interpreting Your Inflation Result
The calculator reports three connected figures. The end value is the amount of money that, at the end year, would be needed to buy what your starting amount bought at the start year. The total change is the dollar difference between the end value and the starting value, and the percentage change expresses that difference relative to the starting amount.
A higher end value does not mean you are wealthier. It represents the same buying power expressed in inflated (later-year) dollars. For example, if $1,000 in the start year grows to $1,344 at the end year, that $1,344 buys the same goods the original $1,000 once did — your purchasing power is unchanged, but more nominal dollars are required to maintain it.
The percentage change shown is the cumulative inflation across the whole period, not the annual rate. These two differ because inflation compounds. With a constant 3% annual rate over 10 years, prices do not rise by \(3\% \times 10 = 30\%\); they rise by \((1.03)^{10} - 1 \approx 34.4\%\), because each year's increase builds on the previous, higher price level.
Use the result to compare amounts fairly across time: to see what a past sum is worth today, or to estimate how much an expense or savings goal must grow simply to keep pace with rising prices. Because the calculation assumes a single average annual rate, actual year-by-year inflation will vary, so treat the figure as an estimate rather than an exact historical conversion.
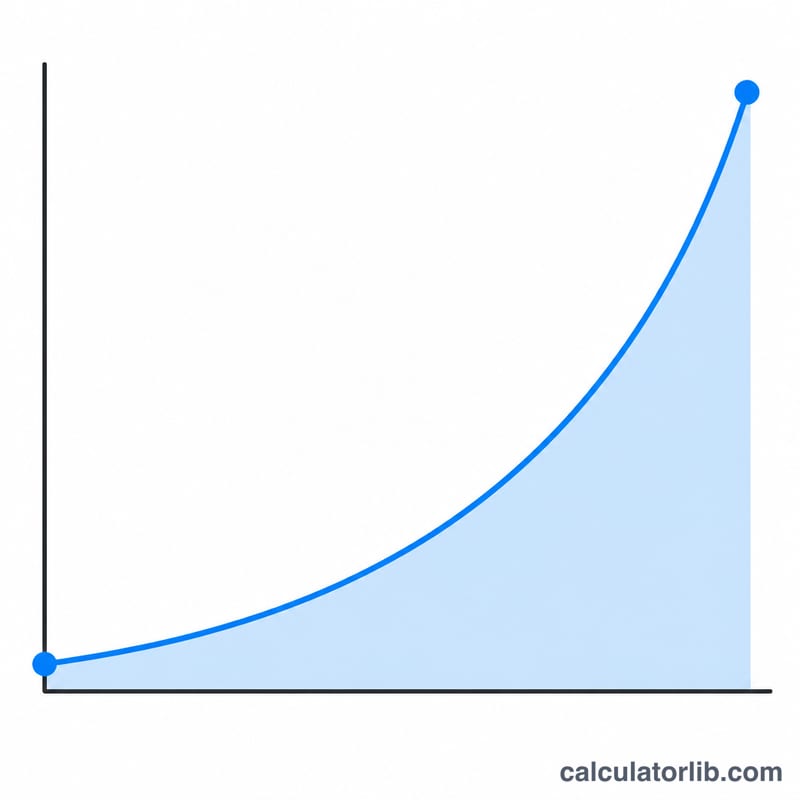
Inflation Impact Across Different Rates and Time Horizons
Inflation has two mirror-image effects on the same number. A fixed basket of goods that costs $1,000 today costs more in nominal terms later, and a $1,000 note kept under the mattress buys less later. Both come from the same compounding factor used by this calculator:
$$FV = PV \times (1 + r)^{n}$$
where \(PV\) is the starting value, \(r\) is the average annual inflation rate as a decimal, and \(n\) is the number of years (end year − start year). The matching loss of purchasing power is:
$$\text{Loss} = 1 - \frac{PV}{FV} = 1 - \frac{1}{(1 + r)^{n}}$$
The table below holds the starting amount fixed at $1,000 and varies only the rate and the horizon. The first figure in each cell is the nominal amount needed to buy the same basket; the percentage below it is how much purchasing power $1,000 in cash would have lost over that period.
| Annual rate | 5 years | 10 years | 20 years | 30 years | ||||
|---|---|---|---|---|---|---|---|---|
| Value | Loss | Value | Loss | Value | Loss | Value | Loss | |
| 2% | $1,104.08 | 9.4% | $1,218.99 | 18.0% | $1,485.95 | 32.7% | $1,811.36 | 44.8% |
| 3% | $1,159.27 | 13.7% | $1,343.92 | 25.6% | $1,806.11 | 44.6% | $2,427.26 | 58.8% |
| 5% | $1,276.28 | 21.6% | $1,628.89 | 38.6% | $2,653.30 | 62.3% | $4,321.94 | 76.9% |
| 7% | $1,402.55 | 28.7% | $1,967.15 | 49.2% | $3,869.68 | 74.2% | $7,612.26 | 86.9% |
| 10% | $1,610.51 | 37.9% | $2,593.74 | 61.5% | $6,727.50 | 85.1% | $17,449.40 | 94.3% |
How one cell is built. For 3% over 30 years:
$$FV = \$1{,}000 \times (1 + 0.03)^{30} = \$1{,}000 \times 2.427262 = \$2{,}427.26$$
$$\text{Loss} = 1 - \frac{ {\$1{,}000}}{\$2{,}427.26} = 1 - 0.41199 = 0.5880 \Rightarrow 58.80\%$$
So goods costing $1,000 today would cost about $2,427 after 30 years of 3% inflation, and $1,000 in cash would buy roughly 41% of what it buys today — a 59% loss, even though the rate sounds modest.
Reading the pattern. Value grows geometrically while purchasing power decays toward zero but never reaches it. Doubling the rate more than doubles the long-horizon effect: at 5% for 30 years the basket costs 4.3× more, at 10% it costs 17.4× more. A useful shortcut is the rule of 70 — prices roughly double in \(70 / r\) years, so 2% doubles in about 35 years, 7% in about 10.
Note on the rates shown. These five rates are illustrative, not forecasts. The 2% row is included because 2% is the stated medium-term inflation target of several major central banks, including the US Federal Reserve and the European Central Bank; the higher rows resemble periods of elevated or high inflation seen in various economies. Actual inflation varies widely by country, by year, and by what you buy — housing, healthcare and education often rise faster than a national consumer price index, while electronics often rise more slowly. Enter a rate drawn from your own country's official statistics agency, and treat this table as a sensitivity check rather than a prediction.
Inflation in United States: the official figures
Official consumer-price data for United States, updated automatically. Use these figures as inputs in the calculator above.
- 12-month change, September 2026
- +3.7%
- Inflation 2024
- 2.9%
- Cumulative 2015–2024
- 32.3%
- Average per year
- 3.2%
Latest change Up +0.3 pp September 2026: +3.7%, against +3.4% in August 2026.
Latest month (September 2026): consumer prices in United States changed by +3.7% over 12 months (Consumer Price Index for All Urban Consumers, CPI-U). The yearly figures below are annual averages. CalculatorLib calculates this change from the published index: index of the month ÷ index of the same month a year earlier − 1.
Prices in United States changed by 32.3% between 2015 and 2024, an average of 3.2% a year: what cost 100 USD in 2015 cost about 132 USD in 2024.
| Year | CPI (2010 = 100) | Inflation | World |
|---|---|---|---|
| 2024 | 143.9 | 2.9% | 3.0% |
| 2023 | 139.7 | 4.1% | 5.7% |
| 2022 | 134.2 | 8.0% | 8.0% |
| 2021 | 124.3 | 4.7% | 3.5% |
| 2020 | 118.7 | 1.2% | 1.9% |
| 2019 | 117.2 | 1.8% | 2.2% |
| 2018 | 115.2 | 2.4% | 2.5% |
| 2017 | 112.4 | 2.1% | 2.3% |
| 2016 | 110.1 | 1.3% | 1.6% |
| 2015 | 108.7 | 0.1% | 1.4% |
United States and other countries
Inflation, consumer prices (annual %) — each country’s latest published year.
- Türkiye 34.9% (2025)
- Russia 8.7% (2025)
- Mexico 3.8% (2025)
- Vietnam 3.3% (2025)
- Japan 3.2% (2025)
- World 3.0% (2025)
- United States 2.9% (2024)
- India 2.4% (2025)
- South Korea 2.1% (2025)
- Saudi Arabia 2.0% (2025)
- France 0.9% (2025)
- China 0.1% (2025)
No published figure yet for Taiwan.
Years can differ between rows: each figure is shown with its own year. The same World Bank indicator for every country.
Latest figure: 2026-09 Data last updated 2026-11-14 · current
Source: The World Bank Group CC BY 4.0; U.S. Bureau of Labor Statistics (BLS.gov), Consumer Price Index Public domain (U.S. government work)
The cumulative change, the average yearly rate and the price comparison are computed by CalculatorLib from these data.
Source details and methodology
- The World Bank Group — World Development Indicators (FP.CPI.TOTL.ZG, FP.CPI.TOTL)
- U.S. Bureau of Labor Statistics (BLS.gov), Consumer Price Index (CUUR0000SA0)