
What is a percentile?
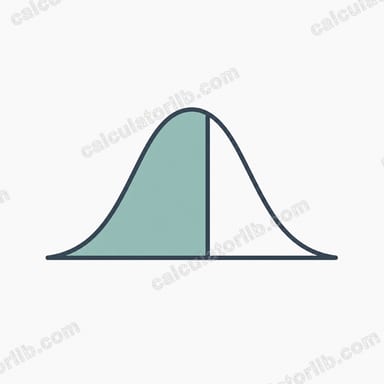
A percentile tells you the value below which a given percentage of observations in a data set fall. For example, the 25th percentile (the first quartile) is the value below which roughly 25% of the data lies. Percentiles are widely used in statistics, standardized testing, growth charts, and salary benchmarking to describe relative standing within a group.
How to use this calculator
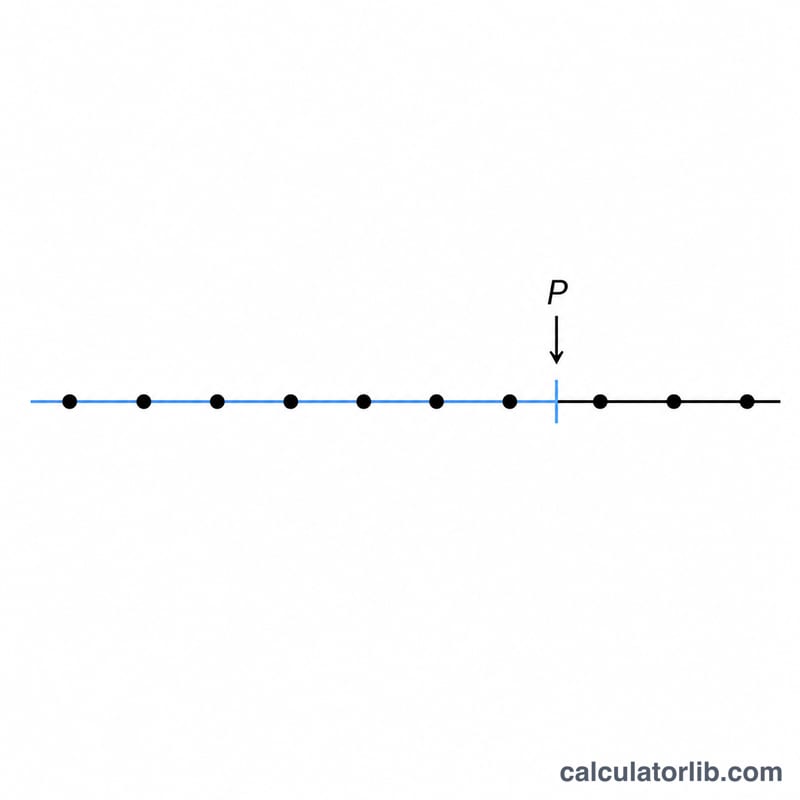
Enter your data values separated by commas or spaces, then type the percentile you want (any number from 0 to 100). The calculator sorts your data, computes the interpolated rank position, and returns the value at that percentile. It also shows the rank position and the number of data points so you can verify the result.
The formula explained
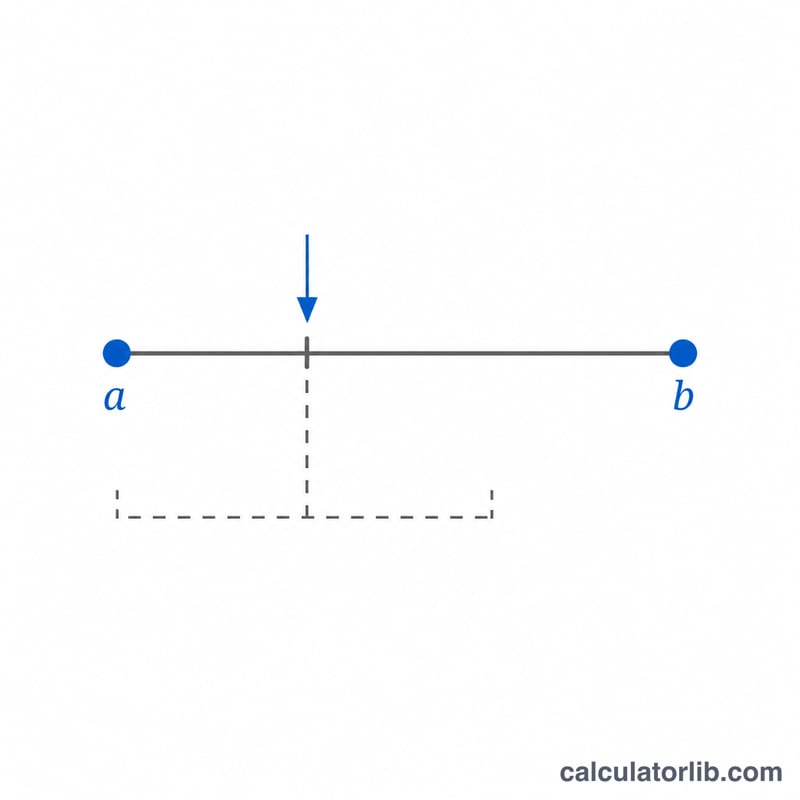
This tool uses the linear interpolation method (the same approach Excel's PERCENTILE.INC uses). First it computes the rank position:
$$R = \frac{P}{100}\,(n-1) + 1$$where \(n\) is the count of values. Let \(k\) be the integer part of the rank and \(f\) its fractional part. The percentile value is then
$$V = x_k + f\cdot(x_{k+1} - x_k)$$where \(x_k\) is the kth smallest value. When \(f\) is zero the result is exactly \(x_k\); otherwise it interpolates between two neighbouring data points.
Worked example
Take the data set 10, 20, 30, 40, 50 (\(n = 5\)) and ask for the 25th percentile.
$$R = \frac{25}{100}(5-1)+1 = 0.25\cdot 4 + 1 = 2$$The rank is a whole number, so the value is the 2nd smallest = 20. For the 40th percentile:
$$R = 0.40\cdot 4 + 1 = 2.6$$so \(k = 2\), \(f = 0.6\), and
$$V = 20 + 0.6\cdot(30-20) = 26$$FAQ
Does the order of my data matter? No. The calculator sorts the values automatically before computing the percentile.
What is the 50th percentile? It is the median — the middle value of the sorted data.
Why does my answer differ from another tool? There are several percentile conventions. This calculator uses the inclusive linear interpolation method; some tools use exclusive or nearest-rank methods, which can give slightly different results.