What the ROAS Calculator Does
Return on Ad Spend (ROAS) tells you how much revenue your advertising generates for every unit of currency you spend. This calculator takes two simple inputs — the revenue your campaign produced and the ad spend that produced it — and instantly returns your ROAS as a percentage, along with your ROI and net profit. It works with any currency, so it suits marketers running Google Ads, Meta, TikTok or any paid channel worldwide.
How to Use It
- Revenue: Enter the total sales revenue attributed to the campaign (e.g. 5000).
- Ad Spend: Enter the amount you paid for the ads over the same period (e.g. 1000).
Press calculate and the tool shows your ROAS percentage, ROI percentage and profit figure.
The Formula Explained
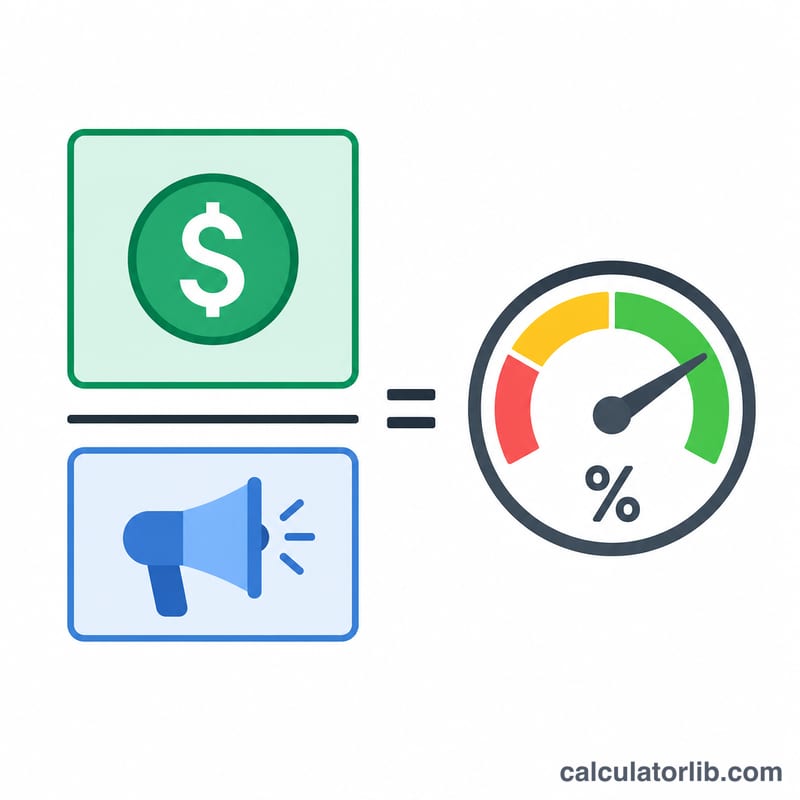
The core calculation is:
$$\text{ROAS} = \frac{\text{Revenue}}{\text{Ad Spend}} \times 100\%$$If ad spend is zero, the calculator returns 0 to avoid dividing by zero. Alongside ROAS, it also derives two related metrics from your inputs:
- ROI = \(\frac{\text{Revenue} - \text{Ad Spend}}{\text{Ad Spend}} \times 100\%\) — your return relative to cost, after subtracting the spend.
- Profit = \(\text{Revenue} - \text{Ad Spend}\) — the raw monetary gain.
A ROAS of 100% means you broke even (revenue equals spend); above 100% you made a gross return; below 100% the campaign lost money on a revenue basis.
Worked Example
Suppose you spent 1,000 on ads and generated 5,000 in revenue:
- ROAS = \((5000 \div 1000) \times 100\% =\) 500% (i.e. 5× your spend)
- ROI = \(\frac{5000 - 1000}{1000} \times 100\% =\) 400%
- Profit = \(5000 - 1000 =\) 4,000
So every 1 spent returned 5 in revenue and 4 in gross profit.
Interpreting Your ROAS Result
Return on ad spend (ROAS) expresses attributed revenue as a proportion of the advertising cost that generated it. This calculator reports it as a percentage:
$$\text{ROAS} = \frac{ {\text{Revenue}}}{ {\text{Ad Spend}}} \times 100\%$$
The same number can be read as a ratio. A ROAS of 500% is 5:1 — five currency units of revenue for every one spent. 250% is 2.5:1, and 80% is 0.8:1. The percentage and the ratio carry identical information; teams on Google Ads and Meta commonly quote the ratio form, while spreadsheets and dashboards often use the percentage.
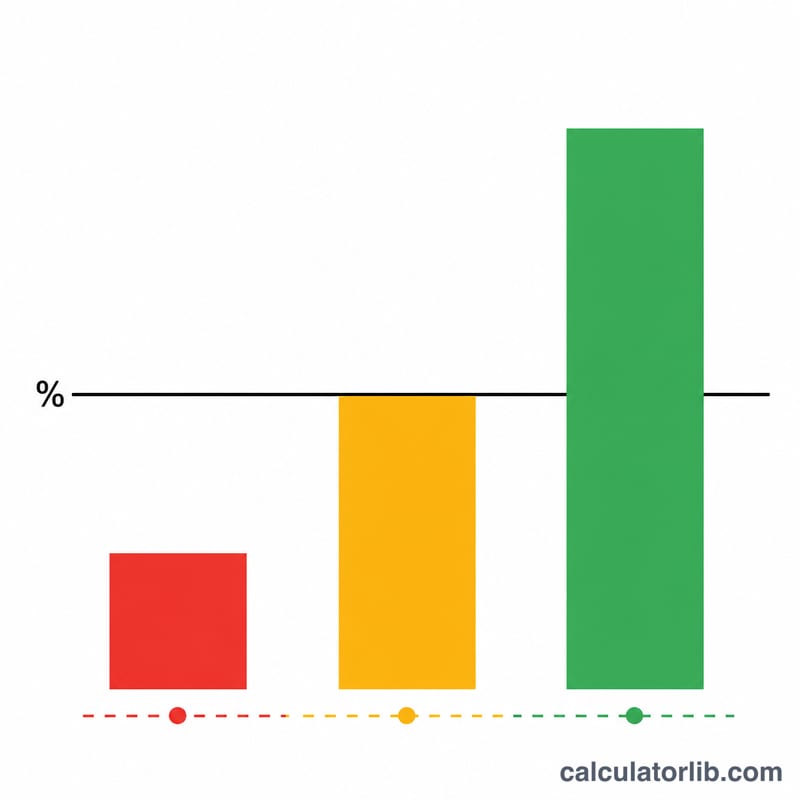
Three reference points anchor the scale:
- Above 100% — attributed revenue exceeds ad spend. A 1,000 spend returning 3,000 revenue is 300%, or 3:1.
- Exactly 100% — revenue equals spend (1:1). This is gross break-even on the advertising line only. Because the cost of the goods or services sold has not been deducted, a campaign at 100% is still losing money in real terms.
- Below 100% — revenue is smaller than the spend that produced it, so the campaign loses money on the ad line alone before any other cost is counted.
Break-even ROAS depends on your margin
The ROAS at which a campaign stops losing money is set by gross profit margin — the share of each revenue unit left after the direct cost of what was sold:
$$\text{Break-even ROAS} = \frac{1}{ {\text{Gross profit margin}}}$$
With a 40% gross margin, break-even ROAS is \(1 \div 0.40 = 2.5\), i.e. 250%. Every 1.00 of spend must bring in 2.50 of revenue so that the 40% margin on it (1.00) exactly repays the ad cost. A 25% margin needs \(1 \div 0.25 = 4\), or 400% ROAS; an 80% margin business needs only \(1 \div 0.80 = 1.25\), or 125%. This is why a 300% ROAS can be comfortably profitable for one advertiser and loss-making for another — the number is meaningless without the margin behind it.
ROAS measures revenue, not profit
The numerator is revenue, so the metric is blind to every cost except the ad spend in the denominator: cost of goods sold, manufacturing, shipping and fulfilment, payment-processing and marketplace fees, returns and refunds, discounts, agency retainers, creative production, software subscriptions, salaries and general overheads. Two campaigns with identical ROAS can have opposite bottom-line outcomes if their product mix, return rates or fee structures differ. Return on investment (ROI) differs precisely here: ROI puts profit in the numerator and is negative whenever the campaign fails to cover its costs, whereas ROAS never goes below zero.
The result is period- and attribution-dependent
A ROAS figure is a statement about one date range and one attribution rule, not a fixed property of a campaign. The same underlying activity can produce very different numbers depending on:
- Attribution window — a 7-day-click window credits fewer conversions than a 28-day-click window, so the same spend shows a lower ROAS under the shorter window. Windows are set per platform and can be changed retroactively in reporting.
- View-through vs click-through — counting conversions from users who saw but did not click an ad (view-through) inflates attributed revenue relative to click-only measurement, sometimes substantially for upper-funnel and display campaigns.
- Attribution model — last-click, first-click, linear, position-based and data-driven models distribute the same revenue differently across touchpoints, moving ROAS between channels without changing total sales.
- Lag and reporting maturity — recent days are typically under-reported while conversions are still being attributed, so a ROAS pulled today for yesterday usually rises later.
- Revenue definition — gross order value, value after discounts, value after returns, and value including or excluding tax and shipping all give different numerators.
Blended vs campaign-level ROAS
Two levels of aggregation are in common use and are not interchangeable. Blended ROAS divides all revenue in a period — including organic, direct, email and repeat purchases — by all paid media spend, and is therefore always at least as high as the paid-only view. Campaign-level (platform) ROAS divides only the revenue attributed to a specific campaign, ad set or channel by that campaign's spend. Because platforms attribute independently, summing campaign-level revenue across Google, Meta and other networks routinely double-counts conversions, so the parts can exceed the whole. Blended ROAS is closer to a business-level accounting figure but cannot isolate the contribution of any one campaign; campaign-level ROAS isolates campaigns but inherits every attribution assumption listed above. When comparing ROAS numbers, confirm that both come from the same level, the same period and the same attribution settings.
FAQ
What is a good ROAS? It depends on margins. Many businesses target 300–400% (3:1 to 4:1), but high-margin products can be profitable at lower ratios while thin-margin goods need more.
Is ROAS the same as ROI? No. ROAS compares revenue to spend, while ROI compares profit (revenue minus spend) to spend. This tool reports both.
Should I use gross or net revenue? Use the revenue directly attributable to the ads. For a clearer profitability view, factor in cost of goods and use the ROI and profit figures shown.