
Что такое процентное отклонение?
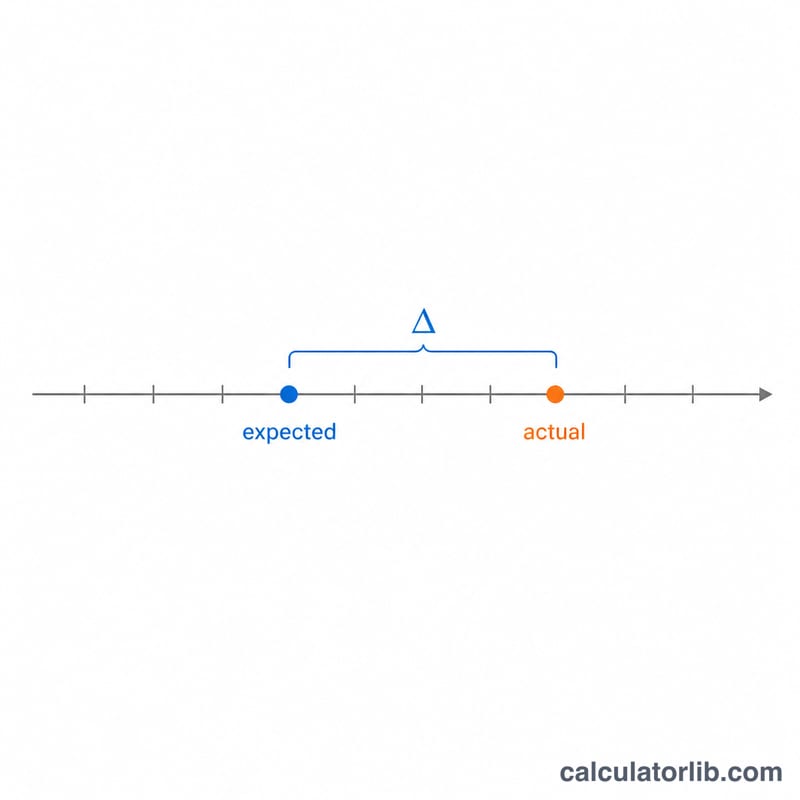
Процентное отклонение — это показатель, который выражает относительную разницу между фактическим и ожидаемым значением в процентах от ожидаемого. Он показывает, насколько сильно наблюдаемое значение отличается от запланированного, поэтому его удобно использовать для оценки точности, эффективности и разброса данных в самых разных сферах.
Когда пригодится калькулятор процентного отклонения
Калькулятор процентного отклонения особенно полезен в следующих ситуациях:
- Контроль качества на производстве — чтобы измерить, насколько готовая продукция отклоняется от заданных спецификаций;
- Научные эксперименты — чтобы сравнить полученные результаты с теоретическими расчётами;
- Финансовый анализ — чтобы оценить разницу между фактическими и прогнозными показателями, например при планировании бюджета или прогнозе продаж.
Как рассчитать процентное отклонение
Процентное отклонение вычисляется по формуле:
$$\text{Процентное отклонение} = \frac{\text{Фактическое значение} - \text{Ожидаемое значение}}{\text{Ожидаемое значение}} \times 100\%$$Расчёт состоит из нескольких шагов:
- Найдите абсолютное отклонение: Фактическое значение − Ожидаемое значение;
- Разделите это отклонение на ожидаемое значение;
- Умножьте результат на 100, чтобы получить значение в процентах.
Положительное процентное отклонение означает, что фактическое значение выше ожидаемого, а отрицательное — что оно ниже ожидаемого.
Примеры расчёта процентного отклонения
Пример 1. Контроль качества на производстве
Производственная линия рассчитана на выпуск металлических стержней ожидаемой длиной 50 см. Фактически измеренная длина образца составила 52 см. Каково процентное отклонение?
$$\text{Процентное отклонение} = \frac{52 - 50}{50} \times 100\% = 4\%$$| Ожидаемое значение | Фактическое значение | Отклонение | Процентное отклонение |
|---|---|---|---|
| 50 см | 52 см | 2 см | 4% |
Пример 2. Финансовый прогноз
Компания запланировала квартальные продажи в размере 200 000 $, но фактические продажи составили 180 000 $. Рассчитаем процентное отклонение.
$$\text{Процентное отклонение} = \frac{180\,000 - 200\,000}{200\,000} \times 100\% = -10\%$$| Ожидаемое значение | Фактическое значение | Отклонение | Процентное отклонение |
|---|---|---|---|
| 200 000 $ | 180 000 $ | −20 000 $ | −10% |
Пример 3. Научный эксперимент
В физическом эксперименте ожидаемое повышение температуры составляло 25 °C, но фактически измеренное повышение оказалось равным 26,5 °C. Каково процентное отклонение?
$$\text{Процентное отклонение} = \frac{26{,}5 - 25}{25} \times 100\% = 6\%$$| Ожидаемое значение | Фактическое значение | Отклонение | Процентное отклонение |
|---|---|---|---|
| 25 °C | 26,5 °C | 1,5 °C | 6% |
Как интерпретировать процентное отклонение
| Диапазон процентного отклонения | Интерпретация |
|---|---|
| 0% | Полное совпадение фактического и ожидаемого значений |
| от 0% до ±5% | Небольшое отклонение, в большинстве случаев допустимо |
| от ±5% до ±10% | Умеренное отклонение, в зависимости от ситуации может требовать внимания |
| более ±10% | Значительное отклонение, как правило, требует разбирательства |
Допустимый уровень процентного отклонения сильно зависит от сферы и конкретной задачи. В отраслях с жёсткими требованиями к качеству приемлемые отклонения могут быть гораздо меньше, чем в других областях.
Похожие калькуляторы
Если вам нужны другие инструменты для статистики и анализа, обратите внимание на эти калькуляторы:
- Калькулятор процентной погрешности — рассчитывает погрешность между измеренным и истинным значением;
- Калькулятор процентной разницы — сравнивает два значения, не выделяя одно из них как «ожидаемое»;
- Калькулятор стандартного отклонения — измеряет разброс данных в выборке.
Определения и глоссарий
Понимание процентного отклонения требует различия между ним и несколькими близкими понятиями. Приведенные ниже термины уточняют, что представляет собой каждое значение и как они соотносятся друг с другом.
- Процентное отклонение
- Мера того, насколько фактическое (наблюдаемое) значение отличается от ожидаемого (эталонного) значения, выраженная как процент от ожидаемого значения. Оно рассчитывается по формуле \(\text{Отклонение \%} = \dfrac{\text{Фактическое} - \text{Ожидаемое}}{\text{Ожидаемое}} \times 100\). Поскольку числитель сохраняет свой знак, результат может быть положительным (фактическое превышает ожидаемое) или отрицательным (фактическое ниже ожидаемого). Например, фактическое значение 110 в сравнении с ожидаемым значением 100 дает отклонение 10%.
- Фактическое значение
- Реальный, наблюдаемый или измеренный результат — число, которое вы фактически получили. В формуле это значение, которое сравнивается, и оно образует первый член числителя.
- Ожидаемое (эталонное) значение
- Прогнозируемое, целевое, теоретическое или исходное значение, по отношению к которому оценивается фактический результат. Оно служит знаменателем в формуле процентного отклонения, поэтому определяет масштаб сравнения. Отклонение, равное нулю, означает, что фактическое значение точно совпало с ожидаемым значением.
- Абсолютное отклонение
- Беззнаковая величина разницы между фактическим и ожидаемым значениями, \(|\text{Фактическое} - \text{Ожидаемое}|\), до деления на эталон и преобразования в проценты. Если взять абсолютное значение процентного отклонения, \(\left|\dfrac{\text{Фактическое} - \text{Ожидаемое}}{\text{Ожидаемое}}\right| \times 100\), вы получите размер расхождения независимо от того, было ли фактическое значение выше или ниже.
- Процентное отклонение в сравнении с процентной ошибкой
- Эти две формулы практически идентичны по структуре, но различаются по подходу. Процентная ошибка рассматривает ожидаемое значение как «истинное» или принятое значение, а фактическое как ошибочное измерение, поэтому обычно выражается как абсолютное (всегда положительное) значение для выражения точности измерения. Процентное отклонение часто сохраняет свой знак, поскольку направление отклонения (выше или ниже эталона) несет важную информацию для анализа и принятия решений.
- Процентное отклонение в сравнении с процентной разницей
- Процентное отклонение делит на одно выбранное значение (ожидаемое значение), что делает сравнение направленным и асимметричным. Процентная разница сравнивает два значения, ни одно из которых не является эталоном, разделяя абсолютную разницу на среднее значение двух значений: \(\dfrac{|A - B|}{(A + B)/2} \times 100\). Используйте отклонение, когда одно значение является четким целевым или прогнозируемым значением; используйте процентную разницу, когда два количества — это просто два измерения равного статуса.