What the Solar Array Power Calculator Does
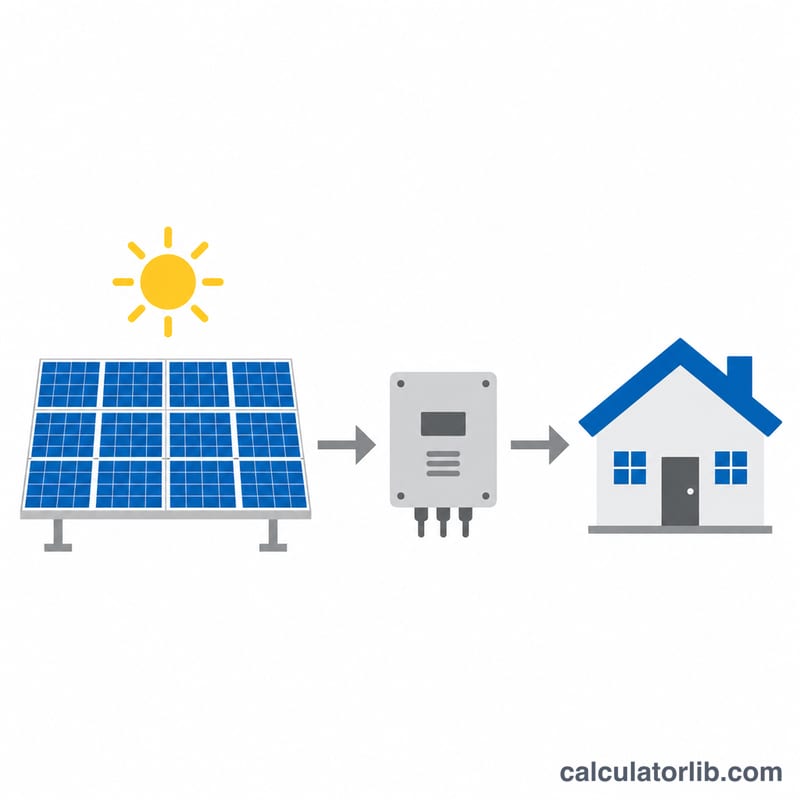
This calculator estimates how much power and energy a photovoltaic array can produce. You enter the rating of one panel in watts, the number of panels, the average peak sun hours per day at your site, and an overall system efficiency. It returns the array rating in kW, usable peak output, and daily, monthly and annual energy in kWh, which is useful for early energy planning and sizing batteries or inverters.
How to Use It
Enter the nameplate wattage printed on your panels and how many you plan to install. Peak sun hours are the equivalent hours per day of 1,000 W/m² sunlight; many locations fall between 3 and 6. System efficiency bundles real-world losses such as inverter conversion, wiring, temperature, soiling and shading; 75 to 85 percent is a common planning range.
The Formula Explained
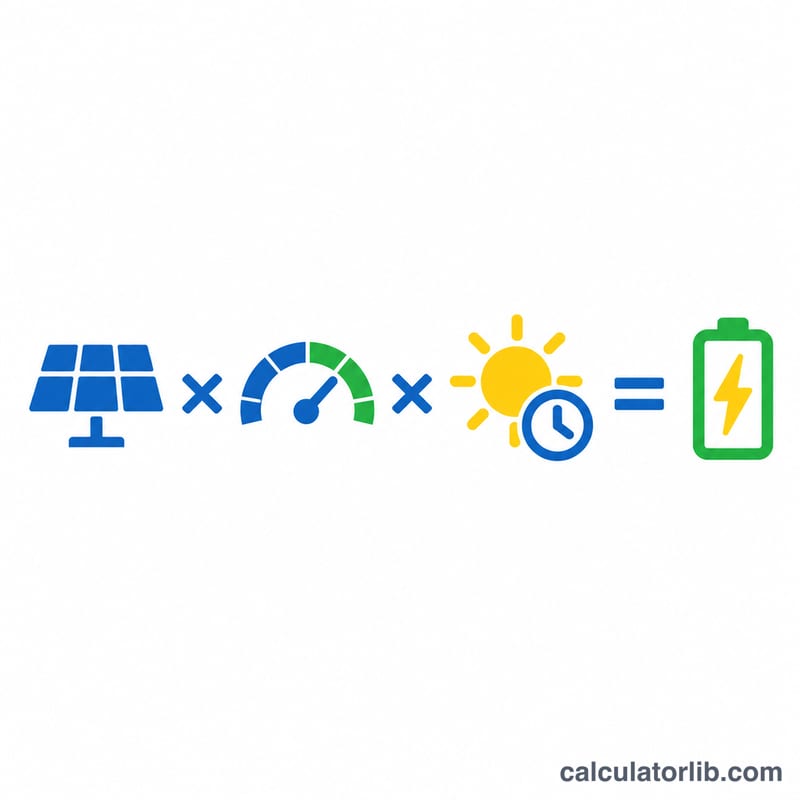
First the array rating is the panel wattage multiplied by the panel count, converted to kilowatts:
$$P_{\text{array}} = \frac{N \times P}{1000}$$Then daily energy is the array rating, scaled by efficiency \(\eta\) and multiplied by the peak sun hours \(H\):
$$E_{\text{day}} = P_{\text{array}} \times \eta \times H$$Annual energy is \(E_{\text{day}} \times 365\) and monthly energy is the annual figure divided by 12.
Worked Example
Take 10 panels of 400 W, 5 peak sun hours and 80% efficiency.
$$P_{\text{array}} = \frac{10 \times 400}{1000} = 4\,\text{kW}$$$$E_{\text{day}} = 4 \times 0.80 \times 5 = 16\,\text{kWh}$$$$E_{\text{year}} = 16 \times 365 = 5{,}840\,\text{kWh}$$That works out to roughly 486.7 kWh per month.
Typical Peak Sun Hours by Region
One peak sun hour equals 1 kWh/m² of solar energy. The table gives rounded, approximate annual average values (kWh/m²/day) on a well-oriented surface for representative locations. Use them as starting estimates for the Peak Sun Hours field.
| Location | Approx. annual average peak sun hours (kWh/m²/day) |
|---|---|
| London, UK | ~2.8 |
| Seattle, USA | ~3.5 |
| Chicago, USA | ~4.0 |
| Madrid, Spain | ~4.8 |
| Denver, USA | ~5.5 |
| Phoenix, USA | ~6.5 |
Note: Real values vary with panel tilt, orientation (azimuth), season and local weather. Winter values can be well below the annual average and summer values well above it. For a site-specific figure, check NREL PVWatts or the Global Solar Atlas.
Output Comparison Across Scenarios
All scenarios use 400 W panels and the formula \(E_{\text{day}} = P_{\text{array}} \cdot \eta \cdot H\), where \(P_{\text{array}} = \text{W} \times \text{panels} / 1000\). Monthly figures assume 30 days and annual figures assume 365 days (daily kWh × 30 and × 365).
| Panels | Array size (kW) | Peak sun hours | Efficiency | Daily kWh | Monthly kWh | Annual kWh |
|---|---|---|---|---|---|---|
| 6 | 2.4 | 3.5 | 75% | 6.3 | 189 | 2,299.5 |
| 10 | 4.0 | 3.5 | 80% | 11.2 | 336 | 4,088 |
| 10 | 4.0 | 5.0 | 75% | 15.0 | 450 | 5,475 |
| 10 | 4.0 | 5.0 | 80% | 16 | 480 | 5,840 |
| 10 | 4.0 | 5.0 | 85% | 17.0 | 510 | 6,205 |
| 10 | 4.0 | 6.5 | 80% | 20.8 | 624 | 7,592 |
| 20 | 8.0 | 6.5 | 85% | 44.2 | 1,326 | 16,133 |
Example substitution (10 panels, 5 h, 80%): \(P_{\text{array}} = 400 \times 10 / 1000 = 4.0\) kW, so \(E_{\text{day}} = 4.0 \times 0.80 \times 5 = 16\) kWh. Over 30 days that is 480 kWh, and over 365 days 5,840 kWh.
Array size scales output linearly. Efficiency and sun hours also scale it directly, so location and system losses can matter as much as panel count.
Key Terms and Losses
- Nameplate rating (STC): The panel's rated power under Standard Test Conditions: 1,000 W/m² irradiance, 25°C cell temperature and a standard air-mass spectrum. Real conditions rarely match this.
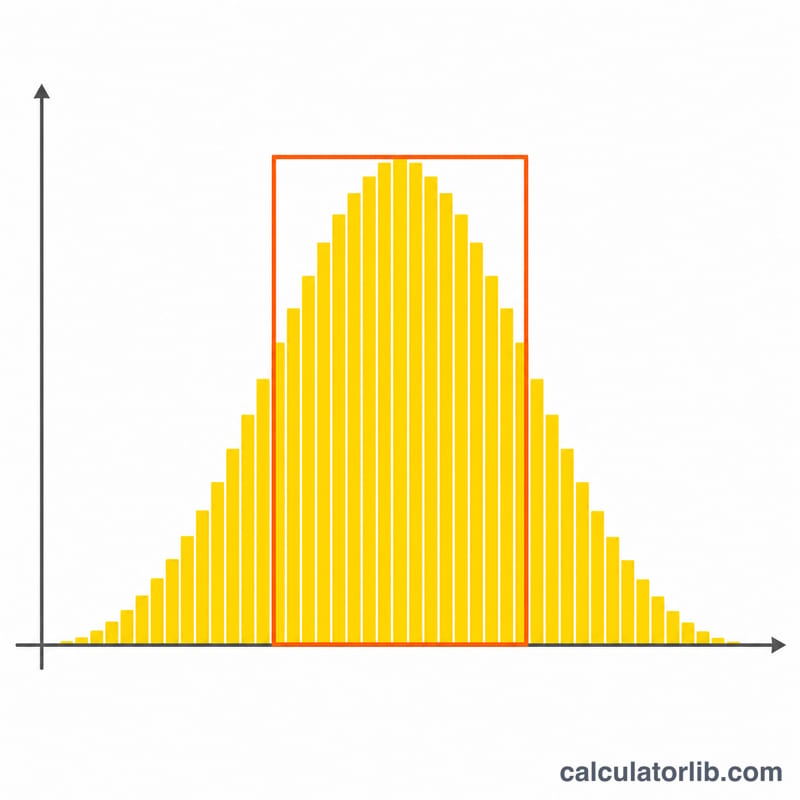
- Peak sun hours: The number of hours per day at an equivalent 1,000 W/m². One peak sun hour equals 1 kWh/m² of energy, so it is a way of expressing total daily solar energy.
- System efficiency (performance ratio): The share of nameplate-based energy that actually reaches your use point, after all losses. Typical planning values are roughly 75–85%, though real systems vary.
- DC vs AC output: Panels produce direct current (DC). An inverter converts it to alternating current (AC) for household use, and the conversion loses some energy. The AC figure is what you can actually use.
- Inverter efficiency: Typically about 95–98% for modern inverters. It is already part of the overall system efficiency value.
- Temperature derating: Panel output falls as cells get hotter than 25°C. The drop is typically a few tenths of a percent per °C, so hot rooftops produce less than STC ratings suggest.
- Soiling: Dust, pollen, bird droppings or snow on the glass reduces the light reaching the cells.
- Shading: Shadows from trees, chimneys or nearby buildings can cut output disproportionately, especially without optimizers or microinverters.
- Wiring losses: Resistive losses in DC and AC cables, usually small if cables are properly sized.
- kW vs kWh: A kilowatt (kW) is a rate of power, such as the array's size. A kilowatt-hour (kWh) is energy, meaning power delivered over time. A 4 kW array producing at full power for 1 hour yields 4 kWh.
FAQ
What efficiency should I use?
If you are unsure, use 80%. Well-designed systems in cool, unshaded locations may reach 85%, while hot or partially shaded roofs may fall to 70% or lower.
Are peak sun hours the same as daylight hours?
No. Peak sun hours compress the day's total irradiance into the equivalent number of hours at full 1,000 W/m² intensity, so they are always fewer than daylight hours.
Does this account for seasonal variation?
No. It uses one average sun-hour value, so monthly results are an average. For seasonal planning, run the calculator with winter and summer sun-hour values separately.