What is CAGR?
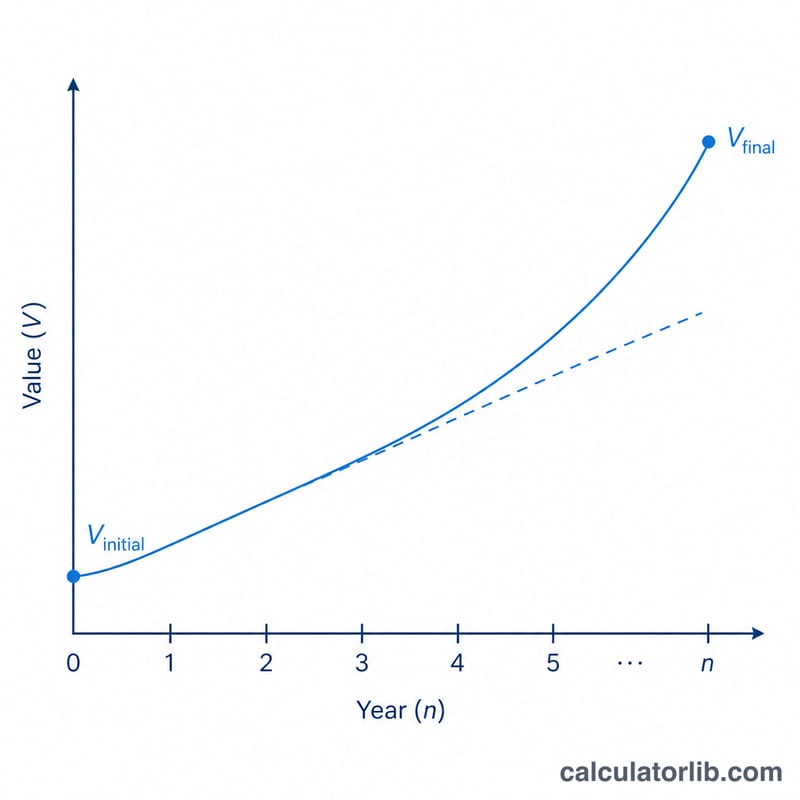
The Compound Annual Growth Rate (CAGR) measures the smoothed annual rate at which an investment or quantity grows from a starting value to an ending value over a set number of years. Unlike a simple average, it accounts for compounding, giving a single "as if it grew steadily" rate that is ideal for comparing different investments or time periods.
How to use this calculator
Enter the initial value, the final value, and the number of years between them. The calculator returns the annualized CAGR as a percentage, along with the total cumulative growth over the whole period.
The formula explained
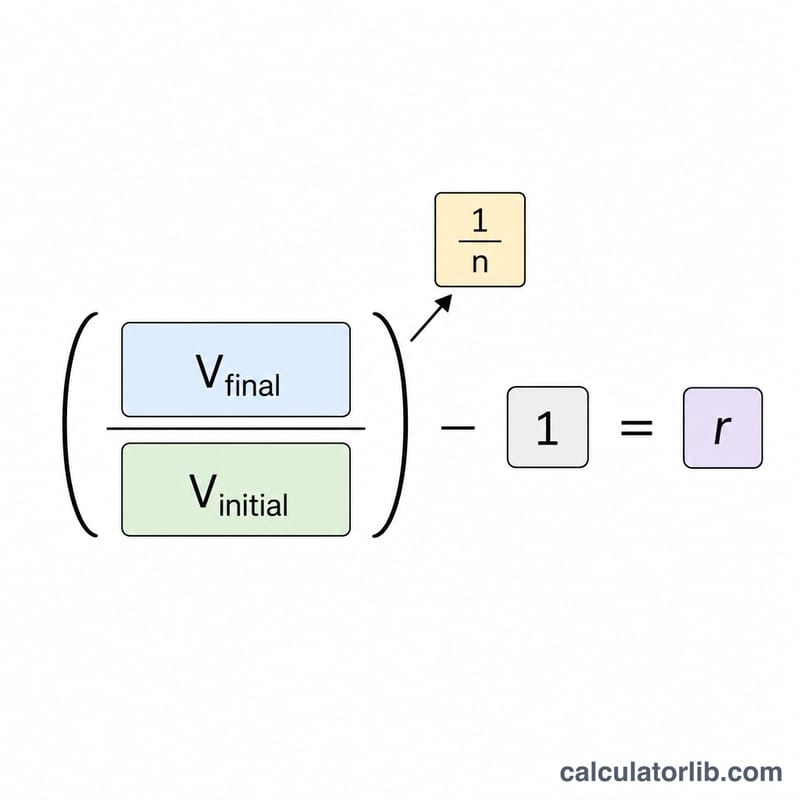
CAGR is found with $$r = \left( \frac{V_{\text{final}}}{V_{\text{initial}}} \right)^{\frac{1}{n}} - 1,$$ where \(n\) is the number of years. Multiply by 100 to express it as a percentage. The total growth is simply \(\frac{V_{\text{final}}}{V_{\text{initial}}} - 1\), ignoring the time dimension.
Worked example
Suppose an investment grows from 1,000 to 2,000 over 5 years. The ratio is 2.0, and \(2.0^{1/5} \approx 1.148698\). Subtracting 1 gives \(0.148698\), so the CAGR is about 14.87% per year. The total growth is 100% over the period.
FAQ
Can the final value be smaller than the initial value? Yes — a decline produces a negative CAGR, indicating the value shrank on average each year.
What if the number of years is less than one? Fractional years work; the exponent \(1/n\) simply annualizes the partial-period growth.
Why use CAGR instead of total growth? CAGR normalizes for time, letting you compare investments held for different durations on an equal footing.