
What Is Engagement Rate by Reach?
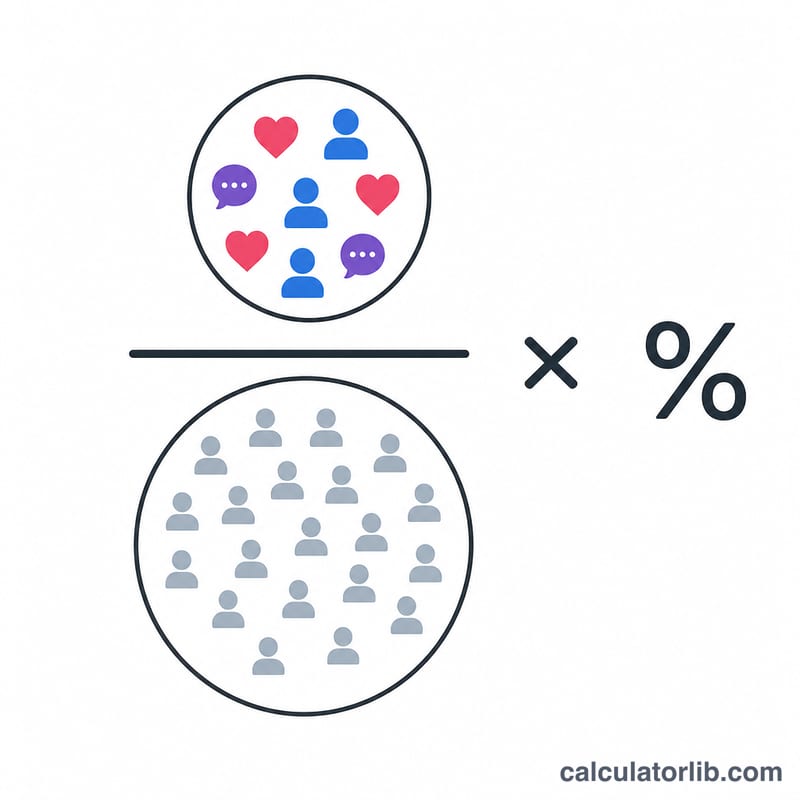
Engagement Rate by Reach (ERR) measures the percentage of people who actually saw your content and then engaged with it — through likes, comments, shares, saves, or clicks. Because reach counts unique viewers (not impressions), ERR is one of the most honest ways to judge how compelling a single post is, independent of your total follower count.
How to Use This Calculator
Enter the total engagements a post received and the total reach (the number of unique accounts that saw it). The calculator divides engagements by reach and multiplies by 100 to express the result as a clean percentage. Both numbers are usually available in your platform's native analytics dashboard.
The Formula Explained
The math is simple:
$$\text{ERR (\%)} = \frac{\text{Total Engagements}}{\text{Total Reach}} \times 100$$
A higher percentage means a larger share of the people who saw your post chose to interact with it. Reach is used as the denominator rather than impressions so that repeat views by the same person don't dilute the score.
Worked Example
Suppose a post earned 500 engagements and reached 10,000 unique accounts. $$\text{ERR} = \frac{500}{10{,}000} \times 100 = 5\%$$ That means 1 in every 20 people who saw the post engaged with it — a strong result for most platforms.
Interpreting Your Engagement Rate by Reach
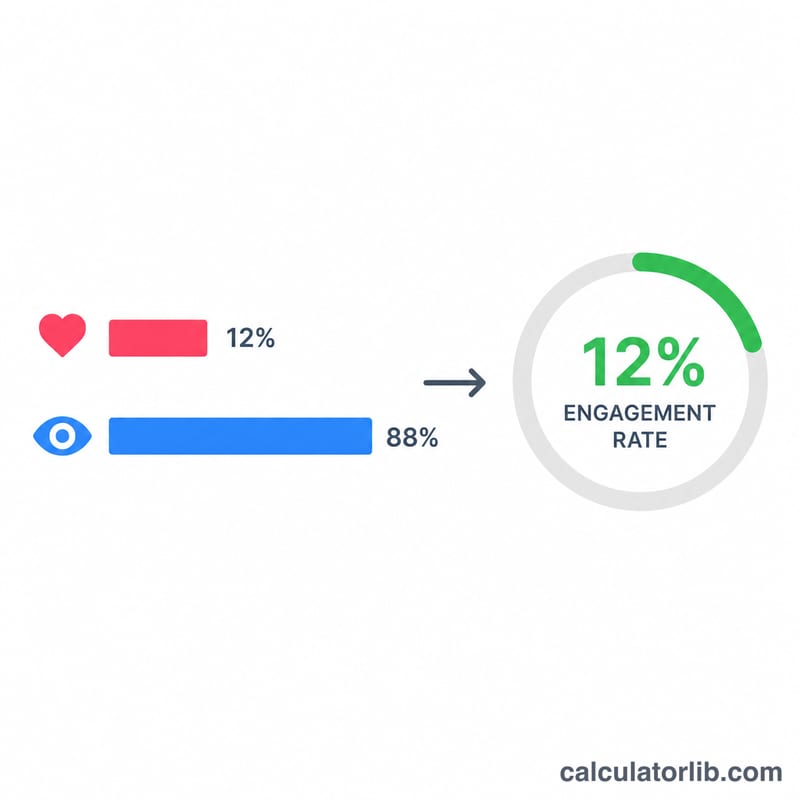
Engagement rate by reach (ERR) is calculated as \(\text{ERR} = \frac{\text{engagements}}{\text{reach}} \times 100\%\). It shows what share of the unique accounts that saw your content actually interacted with it.
General rule-of-thumb bands
| ERR | Typical reading |
|---|---|
| Under 1% | Low: content is being seen but rarely acted on |
| 1% to 3.5% | Average |
| 3.5% to 6% | Good |
| Above 6% | Excellent |
These bands are informal industry rules of thumb, not official standards. They vary a lot by platform, niche, content format and account size, so treat them as a starting point rather than a verdict.
Why ERR is usually higher than follower-based rates
Reach counts only the people who actually saw a post, and those people are often your most active followers. Follower-based rates divide by your whole audience, including many who never saw the post, so the denominator is larger and the percentage is usually lower. Because the denominators differ, never compare an ERR figure directly with a follower-based figure.
Small and niche audiences
Small or highly specialised accounts often show higher ERR. Their audiences tend to be more closely connected to the topic, and the algorithm may show posts mainly to the most engaged followers. As reach expands to broader, less interested audiences, ERR often falls.
How to use the result
- Compare posts over time on the same platform and format.
- Look at trends and averages across many posts instead of a single post.
- Remember that ERR is a relative indicator, not a guarantee of performance, revenue or growth.
ERR Across Different Scenarios
| Scenario | Engagements | Reach | ERR |
|---|---|---|---|
| A: Typical post | 200 | 10,000 | 2% (200 ÷ 10,000 × 100) |
| B: Strong post, same reach | 500 | 10,000 | 5% (500 ÷ 10,000 × 100) |
| C: Same engagements, wider reach | 500 | 50,000 | 1% (500 ÷ 50,000 × 100) |
| D: Small niche audience | 150 | 1,500 | 10% (150 ÷ 1,500 × 100) |
| E: Larger account | 1,200 | 40,000 | 3% (1,200 ÷ 40,000 × 100) |
Scenarios B and C have identical engagements, but reach is five times larger in C, so ERR is five times lower.
When viral reach lowers ERR
Suppose a post reaches 10,000 accounts with 500 engagements: \(\frac{500}{10{,}000} \times 100\% = 5\%\). If it then goes viral and reaches 50,000 accounts with 1,500 engagements, the total engagements tripled, yet \(\frac{1{,}500}{50{,}000} \times 100\% = 3\%\). New viewers outside your core audience usually engage at a lower rate, so ERR can fall even though the post performed better in absolute terms. Always look at engagements and reach together.
FAQ
What is a good engagement rate by reach? Benchmarks vary by platform and niche, but 1–5% is typical and anything above 5% is generally excellent.
Should I use reach or impressions? Use reach for ERR. Reach counts unique viewers, giving a per-person engagement measure; impressions count every view including repeats.
What counts as an engagement? Any deliberate interaction — likes, reactions, comments, shares, saves, and sometimes link clicks, depending on how your platform reports it.