What this calculator does
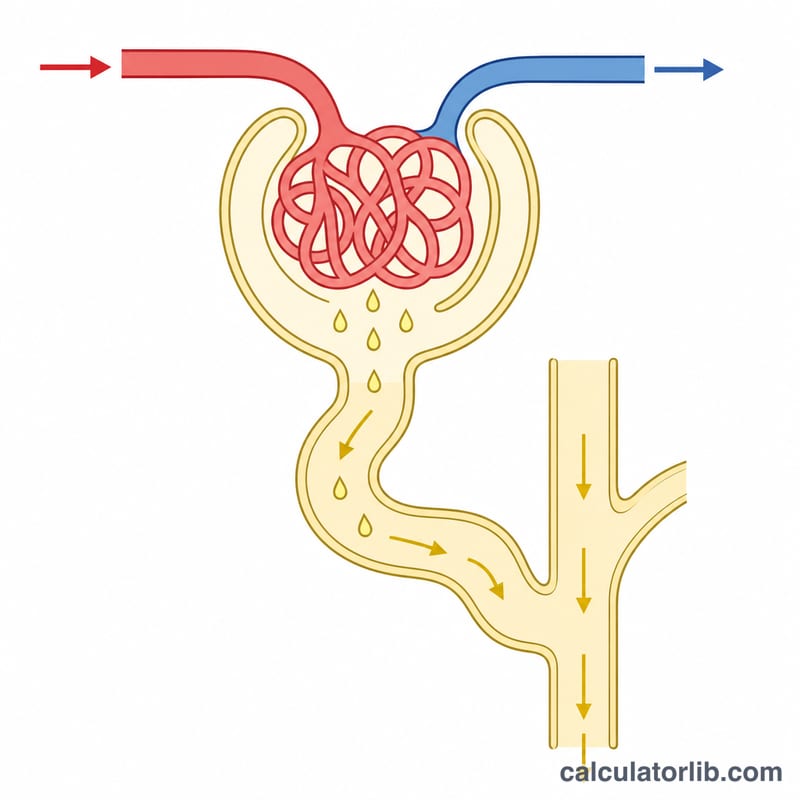
Glomerular filtration rate (GFR) is the volume of blood the kidneys clear of waste each minute, normalised to a body surface area of 1.73 m². Measuring it directly requires a tracer, so clinics estimate it (eGFR) from a routine blood test. This tool uses the 2021 CKD-EPI creatinine equation, the current race-free standard recommended by the NKF-ASN task force and used worldwide.
How to use it
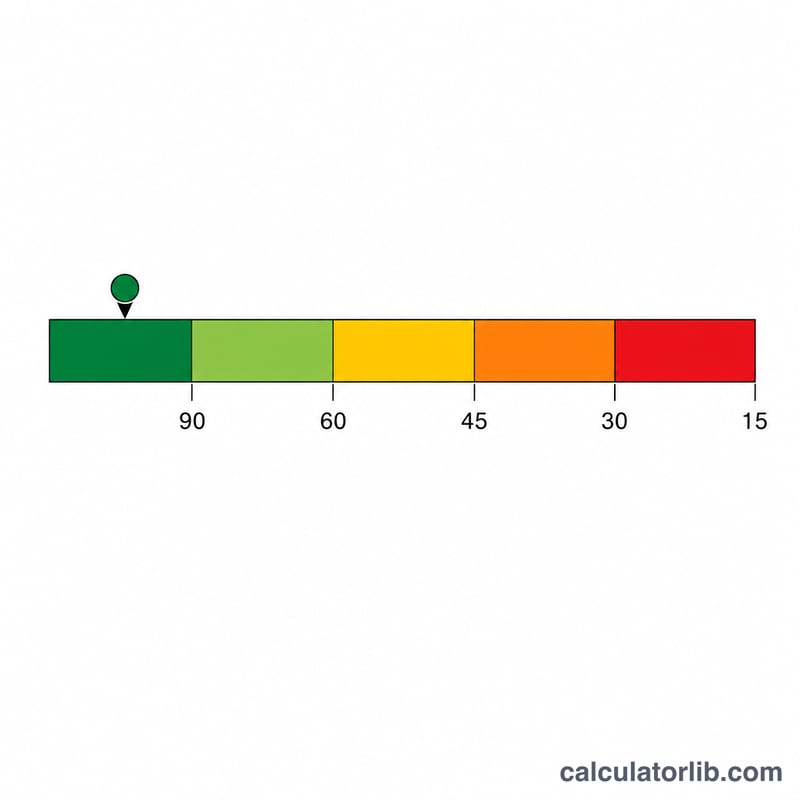
Enter the serum creatinine from your lab report, choose the unit it was reported in (mg/dL in the United States, micromol/L in most other countries), then enter age and sex. The result is your eGFR in mL/min/1.73 m² together with the KDIGO stage band it falls into.
The formula explained
With \(S_{cr}\) = serum creatinine in mg/dL, \(\kappa = 0.7\) (female) or \(0.9\) (male), and \(\alpha = -0.241\) (female) or \(-0.302\) (male):
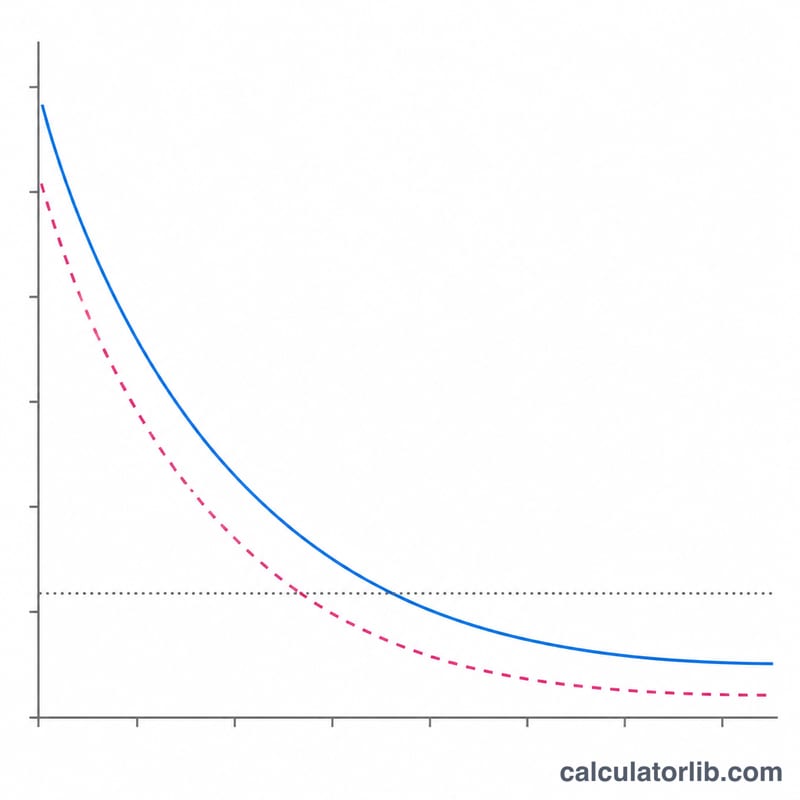
$$\text{eGFR} = 142 \times \min\left(\frac{S_{cr} }{\kappa}, 1\right)^{\alpha} \times \max\left(\frac{S_{cr} }{\kappa}, 1\right)^{-1.200} \times 0.9938^{\text{age}} \times 1.012_{[\text{female}]}$$The split min/max terms let the curve bend at the point where creatinine equals \(\kappa\), so the equation stays accurate at both low and high creatinine values. The term \(0.9938^{\text{age}}\) reflects the gradual decline of filtration with age.
Worked example
A 50-year-old man with a creatinine of 1.0 mg/dL: \(S_{cr}/\kappa = 1.0/0.9 = 1.1111\), so the min term is \(1\) and the max term is \(1.1111^{-1.2} = 0.8812\). The age term is \(0.9938^{50} = 0.7327\).
$$\text{eGFR} = 142 \times 0.8812 \times 0.7327 = 91.7\ \text{mL/min/1.73 m}^2$$That falls in band G1, normal filtration.
Interpreting Your eGFR Result
The number this calculator returns is an estimated glomerular filtration rate (eGFR) in millilitres per minute per 1.73 m², produced by the 2021 CKD-EPI creatinine equation. It places you in one of the GFR categories defined by the international KDIGO clinical practice guideline for chronic kidney disease (CKD):
- G1 — eGFR ≥ 90: normal or high filtration rate.
- G2 — eGFR 60–89: mildly decreased relative to a young adult reference.
- G3a — eGFR 45–59: mildly to moderately decreased.
- G3b — eGFR 30–44: moderately to severely decreased.
- G4 — eGFR 15–29: severely decreased.
- G5 — eGFR < 15: kidney failure.
A category is not the same as a diagnosis. Under the KDIGO definition, categories G1 and G2 on their own do not constitute CKD: an eGFR of 90 or 75 with no other abnormality is simply a filtration rate in the normal-to-mildly-reduced range. CKD in the G1/G2 range requires an additional marker of kidney damage — most commonly albuminuria, but also haematuria, abnormal imaging, histological abnormality, renal tubular disorders or a history of kidney transplantation. This is why eGFR is normally reported alongside a urine albumin-to-creatinine ratio rather than alone.
Chronicity matters. CKD is defined as an abnormality of kidney structure or function that has been present for more than 3 months. A single low reading cannot distinguish chronic disease from acute kidney injury, dehydration, or a transient effect of illness or medication. Confirmation on a repeat sample at least three months later is part of the definition, not an optional extra.
The estimate has real uncertainty. Creatinine-based equations are usually judged by P30 — the proportion of estimates falling within ±30% of measured GFR. For CKD-EPI that figure is roughly 80–90% in the populations where it was validated, which means an eGFR of 60 is compatible with a true GFR somewhere around the low 40s to high 70s, and roughly one estimate in seven can fall outside even that wide band. Treat the result as a band, not a precise measurement, and be especially cautious near a category boundary such as 60 or 30.
The equation assumes creatinine is at steady state. Creatinine is produced by muscle at a fairly constant rate and cleared by the kidneys; the maths only works if production and clearance are in balance. During acute kidney injury or recovery, creatinine lags behind the true filtration rate by a day or more, so eGFR can look reassuringly normal while filtration has collapsed — or look terrible while the kidneys are already recovering. Any calculated eGFR from a rapidly rising or falling creatinine is meaningless. Creatinine is also affected by muscle mass, amputation, severe liver disease, a very high or very low protein intake, creatine supplements, and drugs such as trimethoprim and cimetidine that block tubular creatinine secretion without changing filtration.
The result is indexed to body surface area. eGFR is expressed per 1.73 m², a historical average adult body surface area, so that people of different sizes can be compared on one scale. For some purposes — notably dosing of drugs cleared by the kidneys, and assessment of very large or very small individuals — clinicians de-index the value back to absolute mL/min using the person's own body surface area, or use a different measure such as creatinine clearance. Do not use the indexed number from this page to adjust any medication dose.
This calculator is general information, not medical advice, and it is not a diagnosis. It cannot see your albuminuria, your blood pressure, your medications, your ethnicity-independent laboratory method, or the trend in your previous results — and it is the trend over time, more than any single value, that carries most of the clinical meaning. Interpreting an eGFR, deciding whether it needs repeating, and deciding what if anything follows from it belongs to a qualified clinician who has your full history. If you have a result you are concerned about, take it to your doctor rather than acting on a number from a web page.
CKD Stage Reference Table (KDIGO)
The categories below are the GFR categories used in the KDIGO clinical practice guideline for the evaluation and management of chronic kidney disease (originally published in 2012 and retained in the 2024 update). They are an international standard, not a national one, and all values are in mL/min/1.73 m² — that is, normalised to a body surface area of 1.73 m².
| GFR category | eGFR (mL/min/1.73 m²) | Description |
|---|---|---|
| G1 | ≥ 90 | Normal or high |
| G2 | 60–89 | Mildly decreased |
| G3a | 45–59 | Mildly to moderately decreased |
| G3b | 30–44 | Moderately to severely decreased |
| G4 | 15–29 | Severely decreased |
| G5 | < 15 | Kidney failure |
"Mildly decreased" and similar wordings are relative to the typical level in a healthy young adult. As noted above, G1 and G2 are only classified as CKD when a marker of kidney damage is also present and the abnormality has persisted for more than three months.
Parallel albuminuria categories
KDIGO stages CKD on two axes at once — GFR (G) and albuminuria (A) — because the two together predict outcomes far better than either alone. The albuminuria categories are based on urine albumin-to-creatinine ratio (ACR):
| Albuminuria category | ACR (mg/g) | ACR (mg/mmol) | Description |
|---|---|---|---|
| A1 | < 30 | < 3 | Normal to mildly increased |
| A2 | 30–300 | 3–30 | Moderately increased |
| A3 | > 300 | > 30 | Severely increased |
A full KDIGO description therefore combines both axes together with the underlying cause — for example "CKD G3a A2". This calculator estimates only the GFR axis; it has no information about albuminuria.
Creatinine Unit Conversion (mg/dL ↔ µmol/L)
Laboratories report serum creatinine in two different units depending on the country. Conventional units (mg/dL) are standard in the United States and several other countries; SI units (µmol/L) are standard across most of Europe, the United Kingdom, Australia and Canada. The conversion uses the molar mass of creatinine (113.12 g/mol) and is exact to three significant figures at a factor of 88.4:
$$\text{µmol/L} = \text{mg/dL} \times 88.4 \qquad\text{and}\qquad \text{mg/dL} = \frac{\text{µmol/L} }{88.4}$$For example, a creatinine of 1.2 mg/dL converts as \(1.2 \times 88.4 = 106.08 \approx 106\) µmol/L, and a creatinine of 133 µmol/L converts back as \(133 \div 88.4 = 1.504 \approx 1.5\) mg/dL.
| Creatinine (mg/dL) | Creatinine (µmol/L, rounded) |
|---|---|
| 0.6 | 53 |
| 0.8 | 71 |
| 1.0 | 88 |
| 1.2 | 106 |
| 1.5 | 133 |
| 2.0 | 177 |
| 3.0 | 265 |
| 5.0 | 442 |
Worked example
Suppose a 55-year-old man has a laboratory creatinine of 106 µmol/L. Converting first: \(106 \div 88.4 = 1.199 \approx 1.2\) mg/dL. Because 1.2 mg/dL is above \(\kappa = 0.9\), the min-term equals 1 and only the max-term contributes:
$$\text{eGFR} = 142 \times \left(1\right)^{-0.302} \times \left(\frac{1.2}{0.9}\right)^{-1.200} \times 0.9938^{\,55}$$with \(\left(1.3333\right)^{-1.200} = 0.7081\) and \(0.9938^{55} = 0.7106\), giving \(142 \times 0.7081 \times 0.7106 \approx\) 71 mL/min/1.73 m², which falls in KDIGO category G2.
Assay standardisation matters
The 2021 CKD-EPI equation was developed and validated using creatinine measured on assays that are traceable to an IDMS (isotope-dilution mass spectrometry) reference method. Modern clinical laboratories in most countries have recalibrated to this standard, and results from a standardised assay typically run slightly lower than those from older, non-standardised Jaffe methods. Entering a creatinine value from a non-standardised assay — or from a research, veterinary or point-of-care device that is not IDMS-aligned — will bias the estimate. If your report does not state the units or the method, ask the laboratory rather than assuming. This calculator expects creatinine in mg/dL internally and converts µmol/L inputs by dividing by 88.4.
This page is general information and not a substitute for professional medical advice.
FAQ
Is a low result a diagnosis? No. Chronic kidney disease requires an abnormal eGFR or albuminuria persisting for at least three months, so a single reading needs confirmation.
Why does muscle mass matter? Creatinine comes from muscle turnover, so very muscular people, amputees, and people on high-protein or creatine supplements can get misleading estimates. A cystatin C based equation is preferred in those cases.
Does it work for children? No. CKD-EPI is validated in adults aged 18 and over; paediatric estimates use the Schwartz bedside formula.